
Index
Key Takeaways
Critical Resistance Zones Ahead
Potential Bearish Scenarios
Key Takeaways
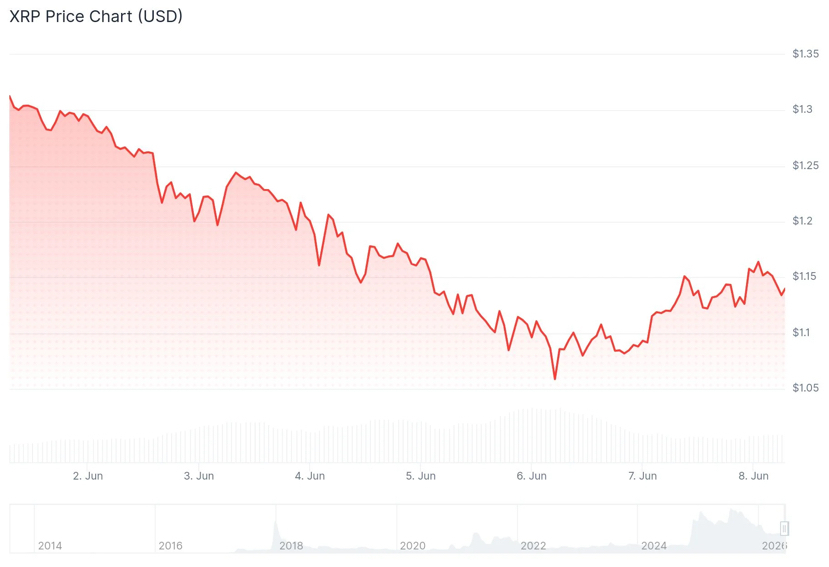
XRP is currently trading at $1.12, marking a 1.82% increase in the last 24 hours, along with a market cap of $69.45 billion
The digital asset has successfully broken a downtrend line at $1.10 and surpassed the 23.6% Fibonacci retracement level
Critical resistance zones are positioned at $1.1720 and $1.2080 — breaking $1.2080 could trigger a rally to $1.2450
If the bullish momentum falters near $1.1740, the downside targets include $1.1250, $1.110, and $1.050.
Technical analyst Ali Charts identifies $0.90 as a potentially robust accumulation zone for long-term investors.
XRP has successfully reclaimed territory above the psychologically important $1 level after recent bearish pressure, currently trading at $1.12. The cryptocurrency recorded a daily gain of 1.82%, accompanied by $2.93 billion in trading volume and maintaining a market capitalization of $69.45 billion.
The upward movement initiated after XRP maintained critical support above the $1.050 threshold. Following this consolidation, market participants pushed the price beyond $1.10 and subsequently up to $1.120, breaking a downward trendline that previously acted as resistance in the 60-minute timeframe.
The token also surpassed the 23.6% Fibonacci retracement level calculated from the decline between the peak of $1.3640 and the low of $1.052. The current price action shows XRP trading comfortably above its 100-hour Simple Moving Average.
Market analyst Ali Charts shared insights on X, highlighting his close monitoring of the $0.90 price zone for XRP. According to his analysis, if the asset returns to that level, it could present an attractive entry point for those with longer investment horizons.
I'm keeping a close eye on $0.90 for $XRP.
If the price gets there, I think it could offer an attractive long-term buying opportunity.
Critical Resistance Zones Ahead
The immediate hurdle facing XRP bulls is at $1.1720. Successfully clearing this barrier would pave the way towards $1.2080, a level that corresponds to the 50% Fibonacci retracement point. Beyond this limit, subsequent targets emerge at $1.2150, $1.220, and finally, $1.2450.
Potential Bear Scenarios
If XRP encounters resistance near $1.1740 and fails to maintain upward momentum, a retracement becomes likely. The first line of defense appears at $1.1250, with additional support at $1.110. A break below $1.110 could accelerate selling to $1.080, potentially extending to the $1.050 region.
The Relative Strength Index currently stands at 25.40, remaining within oversold conditions, though the recent uptick suggests decreasing selling pressure. The MACD indicator continues below its signal line at -0.0700 compared to -0.0476, indicating a persistent short-term bearish momentum.
On June 7th, analyst Crypto Patel noted that XRP is currently trading approximately 37,000% above its lows from 2017. He revealed that his accumulation strategy targets the range of $1.00 to $0.60, suggesting that if XRP eventually hits $10 to $20 in the upcoming market cycles, the current price levels may look like favorable entry points in hindsight.
$XRP – The Same Price, Two Completely Different Emotions:
Think back to 2017. #XRP was trading around $0.003, and every XRP holder had just one dream - "One day this will hit $1." That was the whole fantasy. And in December 2017, it finally happened. XRP crossed $1. It was a party...
The MACD histogram value of -0.0224 confirms that bearish forces remain in control, and a bullish shift would require a positive MACD crossover to definitively signal a change in momentum dynamics.#xrp $XRP
