In June 2026, Bitcoin plummeted from nearly $96,000 at the start of the year to around $61,000, while Ethereum was edging closer to the psychological barrier of $1,500. This isn't just a simple correction; it's a deep game involving macro cycles, institutional funds, and chip structure. This article analyzes the current state of the crypto market and its potential future paths, using the latest market data.
1. From 90k to 60k: a six-month-long 'boiling frog' scenario.
If you stretch the candlestick chart to a weekly timeframe, you'll uncover a staggering reality: Bitcoin is undergoing the longest and most grueling downtrend since peaking in the 2025 bull market.
Looking back at the trajectory of the past six months, the market seems to have been held down by an invisible hand on its lifeline. In early January 2026, Bitcoin was still hovering above $95,000, and at that time, the market was still filled with optimistic expectations of "breaking $100,000 is just a matter of time." However, reality gave everyone a loud slap in the face—mid-January saw a sharp downturn, February touched a low of $63,000, March briefly rebounded to $74,000 before turning back down, and in April, May, and June, it slid step by step.
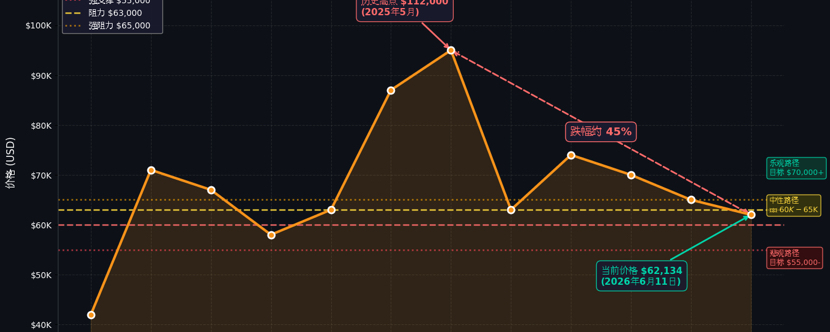
As of June 11, 2026, Bitcoin is priced at around $62,000, a nearly 45% drop from the historical high of $112,000 set in May 2025. This means if you entered near the peak, your unrealized losses are close to being halved. This is not a flash crash but rather a prolonged "boiling frog" scenario—falling a bit every day, setting new lows each week, dragging the bulls deeper into the mire without them realizing it.
Ethereum's situation is even more dire. As the "king of altcoins," ETH has dropped from its 2025 peak, currently priced around $1,600, over a 60% decline from its historical high. More concerning is the continuing decline in the ETH/BTC exchange rate, indicating that in the priority ranking of capital seeking safety, Ethereum is falling significantly behind Bitcoin.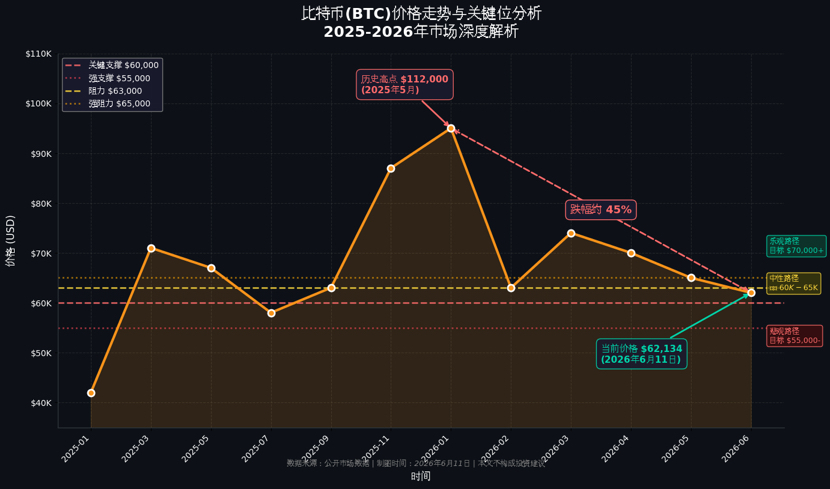
2. Technicals: Is $60,000 the last defense line or just a bearish continuation?
Open up the daily chart of Bitcoin, and you will see a heart-stopping picture: the price has fallen below all major moving averages, with MA7, MA25, and MA99 all in a bearish arrangement. From the $74,000 platform in March 2026, to $70,000 in April, and then to $65,000 in May, each previous support level has turned into a new resistance level.
The most critical technical level right now is at the $60,000 mark. This position is important not just because it is a psychological level, but also because it is precisely the lower edge of the support range formed by the February 2026 low (around $63,000) and the early June low (around $59,000). If $60,000 fails to hold, the next effective technical support will move down to the $61,000 zone in August 2024—this was the bottom platform before the last bull market started.
From a volume perspective, the sharp drop in early June was accompanied by over $70 billion in daily trading volume, which is characteristic of panic selling. However, it’s worth noting that during the rebound from June 9 to 11, trading volume shrank significantly to the range of $30 billion to $40 billion, indicating that bottom-fishing capital wasn't enthusiastic; the market's rebound was more driven by short covering than a trend reversal.
The MACD indicator shows that the DIF and DEA are still operating below the zero line. Although the green bars have contracted, there has not yet been a clear bullish divergence signal. This means that from a purely technical standpoint, the current rebound is more likely a correction in a downtrend rather than the start of a new upward trend.
3. Macroeconomics: When will the Fed's "Damocles' sword" drop?
The crypto market has never existed in isolation; it is closely linked with global macro liquidity. The biggest macro variable currently is undoubtedly the direction of the Fed's monetary policy.
In December 2025, the Fed lifted the limit for the daily $500 billion standing repurchase agreement (SRP), allowing banks to borrow from the Fed against Treasuries without restriction. This policy was interpreted as a "backdoor easing" by the market, briefly pushing Bitcoin from $87,000 to $95,000. However, entering 2026, with repeated US inflation data and resilience in the job market, expectations for interest rate cuts have been continuously delayed.
The CPI data released on June 11 has become the focus of recent market attention. However, strangely, after the data was released, Bitcoin did not follow the expected unilateral trend—after peaking at $62,800, it quickly retraced to oscillate around $62,000. This state of "bad news doesn't drop, good news doesn't rise" precisely indicates that the market has already digested expectations; the real directional choice needs to wait for subsequent clear statements from the Fed.
From a broader perspective, global capital markets are at a delicate balance point. On one hand, the yield on the US 10-year Treasury remains high, increasing the appeal of risk-free assets; on the other hand, geopolitical uncertainties and de-globalization trends continue to support demand for safe-haven assets. The narrative of Bitcoin as "digital gold" hasn't completely failed, but in a high-interest environment, its appeal is indeed being siphoned off by traditional assets.
4. Capital: How long can the ETF's "blood transfusion" last?
In 2025, net inflows from the spot Bitcoin ETF were one of the core drivers of the bull market. BlackRock's crypto investment portfolio surged from $54.7 billion at the beginning of the year to $102 billion, and this institutional-level capital influx once filled the market with confidence.
However, entering 2026, the flow of funds into ETFs has shown a notable reversal. As prices continue to decline, the willingness of institutional capital to allocate has weakened, and some early investors have even begun to take profits. More concerning is the new activity from Mt. Gox wallets, raising market fears of potential selling pressure—if a large number of Bitcoin that has been frozen for years suddenly floods the market, it will further impact the already fragile prices.
From on-chain data, the holding ratio of long-term holders (addresses holding for over 155 days) has recently shown subtle changes. Some "diamond hands" are starting to loosen, transferring chips to exchanges; meanwhile, the activity of short-term traders is declining, indicating that market participants' confidence is being tested.
5. ETH: The "difficult brother" that is half a beat weaker than BTC
If Bitcoin is still struggling around the $60,000 mark, Ethereum's situation is even more challenging.
From the 4-hour chart, ETH rebounded from a low of $1,505, reaching around $1,668, and then retraced continuously. It is currently oscillating around $1,600. Compared to Bitcoin, which has regained its short-term moving averages, ETH hasn't even fully escaped the pressure from the MA25, showing a clearly weaker trend.
On the MACD front, the DIF and DEA formed a golden cross below the zero line, and the green bars have almost disappeared, indicating that short selling power is diminishing. However, like BTC, the golden cross below the zero line represents more of a rebound repair rather than a trend reversal.
The most critical level for ETH going forward is $1,600. As long as this level holds, there is still a chance to test $1,665-$1,670; if $1,600 fails, the market will likely turn back to test $1,500 or even lower levels.
From an ecological fundamental perspective, the Layer 2 narrative of Ethereum has fully matured by 2025, but entering 2026, the market begins to question the actual value capture ability of its scalability solutions. Meanwhile, the rise of competitors like Solana has siphoned off some developers and users, threatening ETH's status as the "king of altcoins."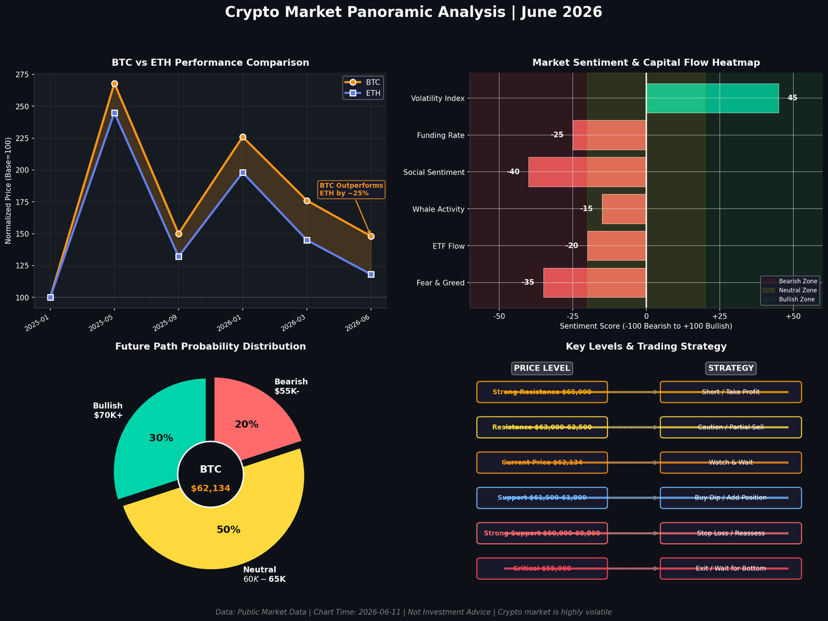
6. Why did the data come out, but the market didn't move?
This is a common confusion among many investors lately: why hasn't the market given a clear direction even after the CPI data was released?
The reason is actually simple.
First, the market has already priced in expectations. Whether going long or short, many positions were established before the data was released. When the actual data came out, there wasn't much new capital entering the market. It's like an exam; everyone already knows the answers, and when the scores are released, it’s surprisingly calm.
Second, a single piece of data cannot change the overall trend. What everyone is looking at is not just a single CPI report, but the entire interest rate cut path ahead. One piece of data cannot completely alter market expectations; large funds prefer to wait for subsequent Fed statements and new macro data to decide the next direction. In this "waiting for consensus" state, the market will naturally choose to oscillate rather than make a unilateral breakthrough.
Third, the chip structure itself does not support a quick reversal. From $60,000 to $110,000, a large amount of trapped positions accumulated in between. Every rebound faces selling pressure from those looking to break even; every drop triggers stop-loss orders. This back-and-forth struggle between bulls and bears will inevitably keep the market in a choppy pattern in the short term.
7. Future Outlook: Three Possible Paths
In light of the current complex market environment, we might as well use scenario analysis to deduce possible future paths.
Scenario 1: Optimistic Path (Probability 30%)
The Fed will likely signal a clear interest rate cut in the June or July FOMC meeting, improving global liquidity expectations and leading institutional funds back into the crypto market. Bitcoin completes its bottoming process near $60,000, followed by a rebound targeting $70,000; if it can break through, it may challenge $80,000. In this scenario, ETH will also rebound, but the magnitude may be weaker than BTC.
Scenario 2: Neutral Path (Probability 50%)
The Fed maintains the current interest rate, and the market continues to oscillate in the $60,000-$65,000 range. Bitcoin is forming a short-term bottom near $60,000 but lacks sufficient upward momentum, presenting an overall horizontal pattern of "pressure above, support below." In this state, the market may need to wait longer to choose a direction, and investors need to have enough patience.
Scenario 3: Pessimistic Path (Probability 20%)
If the $60,000 level fails to hold and is accompanied by a decline in volume, the market may enter a new round of panic selling. The next key support is around $55,000; if that level also fails, it could further drop to $50,000 or even lower. In this scenario, ETH might drop to the $1,200-$1,300 range, and the entire crypto market's capitalization will significantly shrink.
8. Thoughts for Investors: Seeking Certainty in Uncertainty
As of June 2026, the crypto market is in a typical "chaotic phase"—the old trends have ended, and new trends have yet to form. For investors, this is harder to navigate than a clear rise or fall, as human nature inherently dislikes uncertainty.
But what I want to say is that it is precisely in such uncertainty that the biggest opportunities lie.
From an asset allocation perspective, if you believe in the long-term value of crypto assets, the current low levels may present a window for gradually building positions. But the premise is that you must manage your positions and control risks—do not use leverage, do not go all-in, and do not borrow money to invest. The market can handle volatility, but your account cannot handle liquidation.
From a trading strategy perspective, in unclear directional markets, the best strategy may not be frequent trades but reducing activity. Wait for the market to give clear signals—whether it's a breakout with volume or a breakdown with volume—then trade with the trend. In a choppy market, less is more.
From a mindset management perspective, remember: the market is always right; our expectations are what’s wrong. When Bitcoin dropped from 110k to 60k, instead of complaining about "why did it drop so much," think about "what is the market telling me with its price?" Price is the most honest language; it doesn't lie and doesn't cater to anyone's expectations.
Conclusion: Enduring solitude allows us to witness the bloom.
This summer of 2026, the crypto market is undergoing a profound cleansing. Bitcoin is hovering around the $60,000 mark, Ethereum is struggling near $1,600, and countless investors are enduring the agony of shrinking accounts.
But history tells us that every significant adjustment is to accumulate energy for the next upward movement. The bear market of 2022 gave birth to the bull market of 2024-2025, and the adjustments of 2026 may be laying the groundwork for 2027 and even further into the future.
The key question is: when opportunities arise again, will you still be in the game?
The market won't stop moving because of your anxiety, nor will it change direction because of your prayers. All we can do is stay rational, manage risks, and patiently wait. Enduring solitude allows us to witness the bloom.
In this uncertain market, certainty exists only in one place—your understanding and management of risk.
Disclaimer: This article is based on publicly available market data analysis and does not constitute investment advice. The cryptocurrency market is highly volatile, so invest cautiously. #美国CPI升至4.2%创三年新高 #美国持续打击伊朗纳指跌1% #美国对伊朗发动新打击油价上涨 #美国5月CPI将公布!预测攀升至4.2% #美国5月核心CPI低于预期 $BTC


