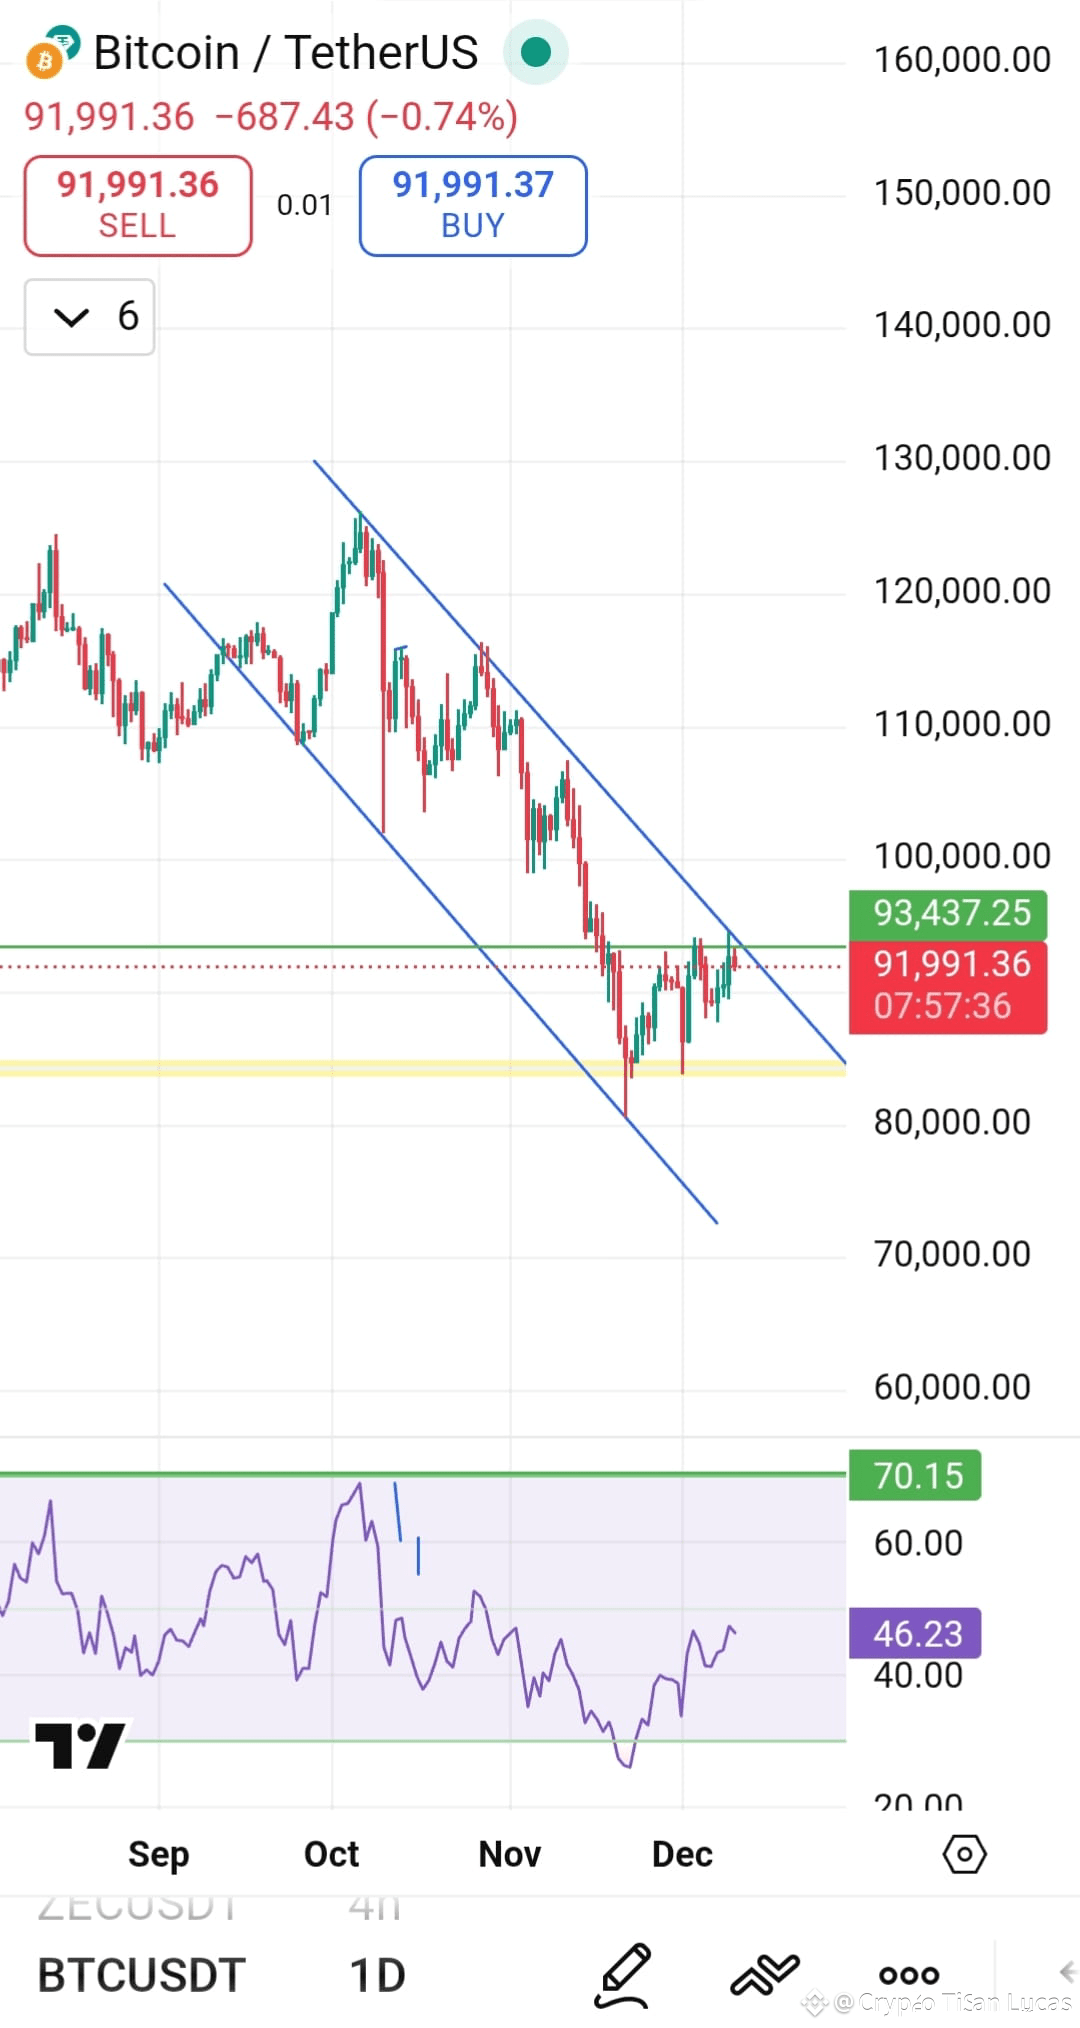
Based on the provided Bitcoin chart (BTC/USDT daily), here is a technical analysis with a bearish perspective:
Bearish Signals & Factors:
1. Break Below Key Support:
· The price has decisively broken below the rising trendline support that was in place from September through December.
· The $93,437** level (previous support) has been lost, and price is currently trading near **$91,991.
2. Lower Highs & Lower Lows:
· The chart shows a clear shift in structure:
· Previous highs near $150,000
· Recent highs near $130,000
· Current price below $92,000
· This indicates a downtrend is in play.
3. Volume Confirmation:
· The volume bars (bottom pane) show increased selling volume (red) as price declined, confirming bearish momentum.
4. Moving Averages:
· Price is trading below key moving averages (visible on chart as curved lines), which are now acting as resistance.
5. Next Bearish Targets:
· Immediate support: $90,000 (psychological level)
· Next major support: $80,000 (previous consolidation zone)
· Further downside: $70,000–$72,000 (long-term support area from earlier in the year).
6. RSI & Momentum:
· The RSI (shown at the bottom) is in bearish territory (below 50), indicating weakening momentum.
Bearish Scenario Summary:
If Bitcoin fails to reclaim $93,500–$94,000, further downside toward $80,000** is likely. A break below **$90,000 could accelerate selling.
#USBitcoinReserveDiscussion #CPIWatch #BinanceAlphaAlert #CryptoRally #WriteToEarnUpgrade $BTC