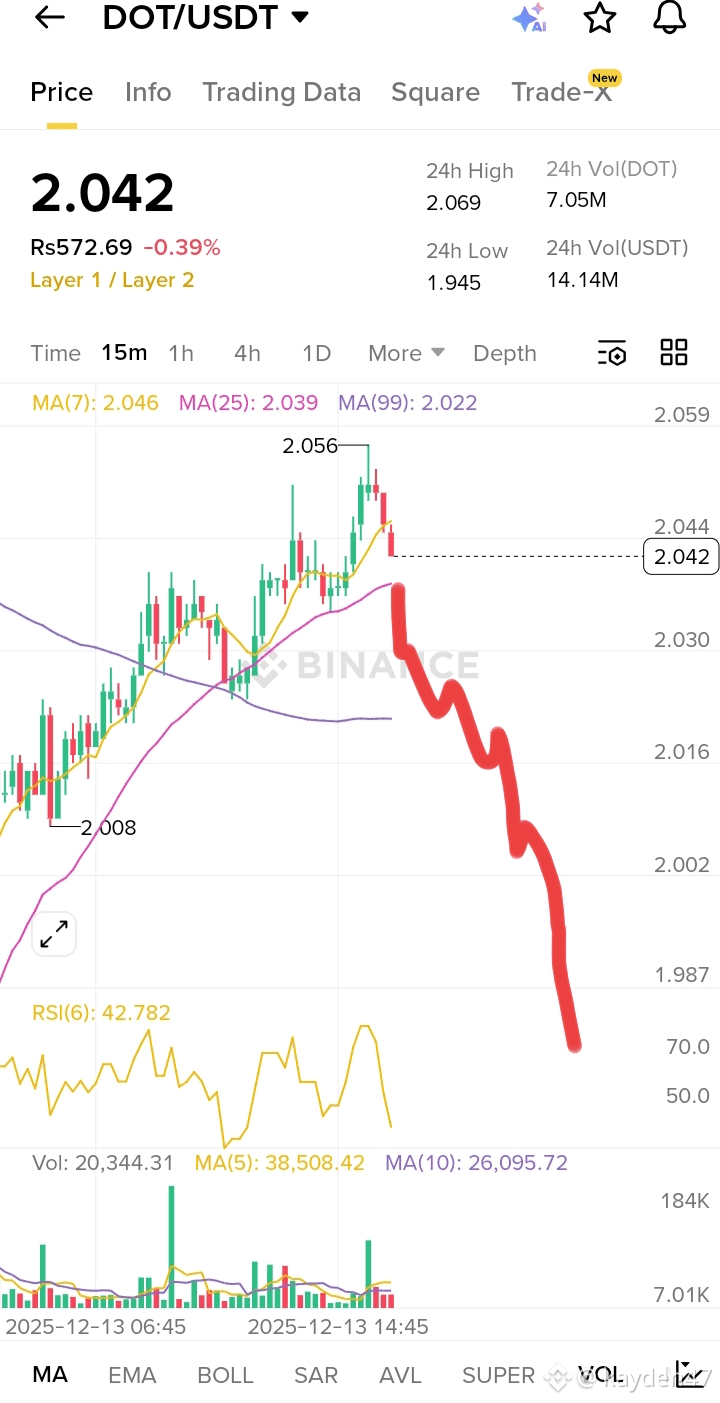
Based on the provided image, we can see the DOT/USDT trading pair on Binance using the 15-minute timeframe, and the market is currently showing clear bearish pressure. The current price is around 2.042 USDT, which is below the daily high of 2.069 USDT. This decline indicates that buying strength is weakening while sellers are gradually gaining control of the market.
Looking at the price action, DOT recently attempted an upward move and reached the 2.056 level. However, the price faced strong rejection from that area, followed by consecutive red candles. This rejection suggests the presence of strong resistance and confirms that sellers are active at higher levels. When price fails to hold above resistance and starts forming lower candles, it often signals bearish continuation.
Analyzing the Moving Averages (MA):
MA(7): 2.046
MA(25): 2.039
MA(99): 2.022
The price has dropped below the MA(7), which is a short-term bearish signal. The MA(25) is acting as a nearby support, but if the price closes below it, selling pressure may increase further. The MA(99) is a key support zone, and a breakdown below 2.022 could trigger a sharper downside move.
The RSI (Relative Strength Index) is around 42.78, which is below the neutral 50 level. This indicates bearish momentum. Although the market is not yet oversold, the RSI suggests that sellers currently have the upper hand. If RSI moves closer to 30, it may signal oversold conditions, but for now, the trend remains weak.
Volume analysis also supports the bearish scenario. Buying volume appears weak, while selling pressure is more dominant. The volume moving averages (MA 5 and MA 10) indicate a lack of strong bullish interest. When price declines with weak buying volume, it often confirms trend continuation to the downside.
Key Support and Resistance Levels:
Immediate resistance: 2.056 – 2.060
Major resistance: 2.069
Immediate support: 2.030 – 2.022
Strong support: 2.000 – 1.987
If DOT breaks below the 2.030 support zone, the next major target could be the 2.000 psychological level. Such levels often attract strong reactions, either a temporary bounce or a strong breakdown. If bearish momentum continues, a move below 2.000 cannot be ruled out.
Overall market sentiment also depends heavily on Bitcoin and the broader crypto market. Any weakness in Bitcoin often leads to stronger selling in altcoins like DOT. This correlation increases downside risk during bearish phases.
For short-term traders, caution is advised. Until the price reclaims 2.056 with strong volume, bullish confirmation is lacking. Short positions may remain favorable with proper risk management and stop-loss placement.
For long-term investors, this zone may offer accumulation opportunities, but gradual buying is safer than entering with full capital at once, as the bearish trend has not yet clearly ended.
Conclusion:
Based on the image, the DOT/USDT market is currently in a bearish phase. Price action, moving averages, RSI, and volume all point toward continued selling pressure. Unless a strong bullish breakout occurs, downside risk remains significant.
Disclaimer: This analysis is for educational purposes only and not financial advice. The crypto market is highly volatile—always do your own research (DYOR)