Latest trend analysis of gold market:
On Monday morning, spot gold plummeted more than 2%, and the current price is around $4720 per ounce. The negotiations between the United States and Iran over the weekend failed, mainly stuck on three issues: whether the Strait of Hormuz can be reopened, how to control Iran's enriched uranium, and how to unfreeze Iran's overseas assets. After the breakdown of talks, both sides hardened their stance: the United States announced that it would begin to blockade Iranian ports starting on the 13th, and Trump is also considering a small-scale strike against Iran; the geopolitical situation suddenly became tense again, and everyone feels that the possibility of a Fed rate cut has decreased, with the market now believing that the probability of maintaining the interest rate in April is as high as 98.4%. Additionally, the U.S. March CPI data was released, showing the largest month-on-month increase in nearly four years, with inflation remaining relatively high, which also suppressed gold prices. Among other precious metals, spot silver rose 1.6% to $76.26, while platinum and palladium fell slightly, but overall this week has seen increases.
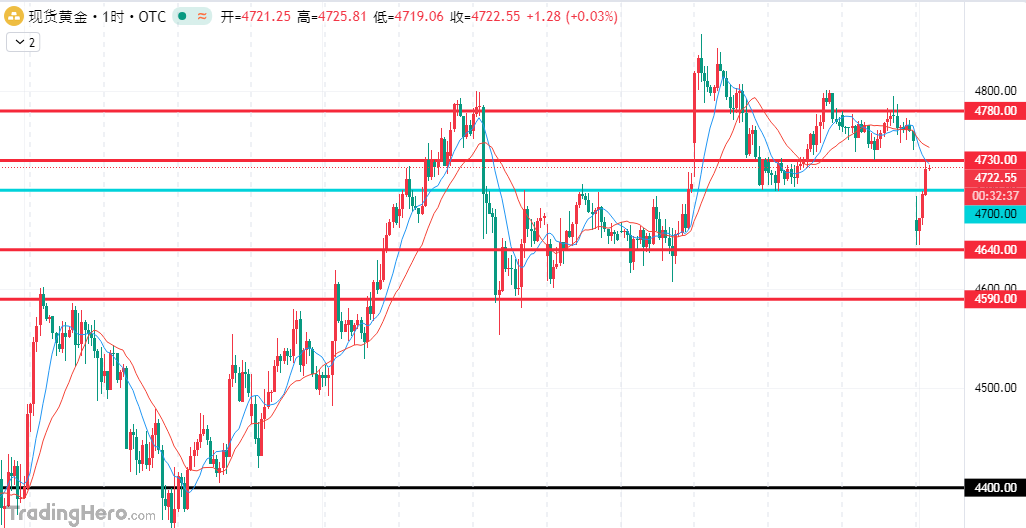
Today, gold opened with a significant gap down, much lower than last Friday's closing price. After the opening, it continued to fall, hitting a low near 4644, with a substantial intraday decline. The market clearly shows weakness, and bearish sentiment has emerged. This sharp drop is not caused by a single reason, but rather a combination of escalating geopolitical conflicts, cooling interest rate cut expectations, and technical breakdowns at key levels. In the short term, the key is whether support can hold.
From the market perspective, the technical breakdown has intensified the downward trend. Gold had been oscillating above 4700, which was an important defensive line for bulls. Today, it opened and directly fell below this level, triggering many automatic stop-loss sell orders. Additionally, with limited market funds in the morning, there was no one to absorb selling pressure, causing a faster decline. In terms of support, the key short-term levels to watch are 4610-4630, which were significant support during previous oscillations, and are still supported by moving averages. If it can stabilize here, there is a chance for a rebound; further down, strong support is at 4447, and if it falls below this, it may head toward 4400. Resistance-wise, 4700 has now become strong resistance, with 4770 above it; these two levels must be broken for the bearish momentum to ease, as the overall trend remains in a range-bound oscillation. In summary, for today's short-term gold trading strategy, I recommend focusing on selling on rebounds while considering buying on dips. The short-term resistance to watch above is at 4730-4780, and the short-term support below is at 4640-4590.
Latest trend analysis of crude oil:
On Monday morning, U.S. crude opened high, with an increase of 8%, once rushing above 105.50 USD/barrel, now around 104.10 USD/barrel. Today, the focus is on whether it can stabilize above 105. Last Friday, international oil prices fell, with Brent crude down 0.8% to 95.20 USD/barrel, and U.S. crude down 1.3% to 96.57 USD/barrel. Last week saw a significant drop, with declines of 12.7% and 13.4%, marking the largest weekly drop since 2022. Initially, there were talks of a permanent ceasefire between the U.S. and Iran, prompting early market sell-offs. However, oil transport in the Strait of Hormuz remains heavily restricted, and previous attacks have caused Saudi Arabia to reduce production by 600,000 barrels per day.
From a technical perspective, the daily chart shows signs of strengthening, with prices approaching a critical resistance level. Currently, bulls have the upper hand, with 100 USD being an important threshold. If it can effectively break through, prices may rise to 103-105; meanwhile, the lower support has moved up to 95, and if it falls below this, it may retest 92. Indicators show strong upward momentum, and the trend is bullish. On the 4-hour chart, oil prices are in an ascending channel, with moving averages lined up bullishly, steadily rising. Short-term support is around 97, and resistance is at 103. If it breaks above 105, more buying interest will enter; if it cannot break through, it will oscillate at high levels. Overall, for today's crude oil trading strategy, I recommend focusing on buying on dips while considering short positions on rebounds. The short-term resistance to watch above is at 110.0-115.0, and support below is at 100.0-95.0.