On Monday, international gold prices opened with a significant drop, falling more than 60 dollars, a decrease of 1.5%, with the lowest point around 4737 dollars. Last Friday, prices were strong, but on Monday, they were directly pushed back down, mainly due to incidents in the Middle East over the weekend: the Strait of Hormuz was closed again, and the U.S. military detained an Iranian ship in the Gulf of Oman and opened fire. Iran responded defiantly, stating it would not participate in the second round of negotiations and would seek revenge. These events have raised concerns about rising energy prices and inflation, leading to a decrease in expectations for interest rate cuts from the Federal Reserve, which caused a surge in the dollar and severely pressured gold prices.
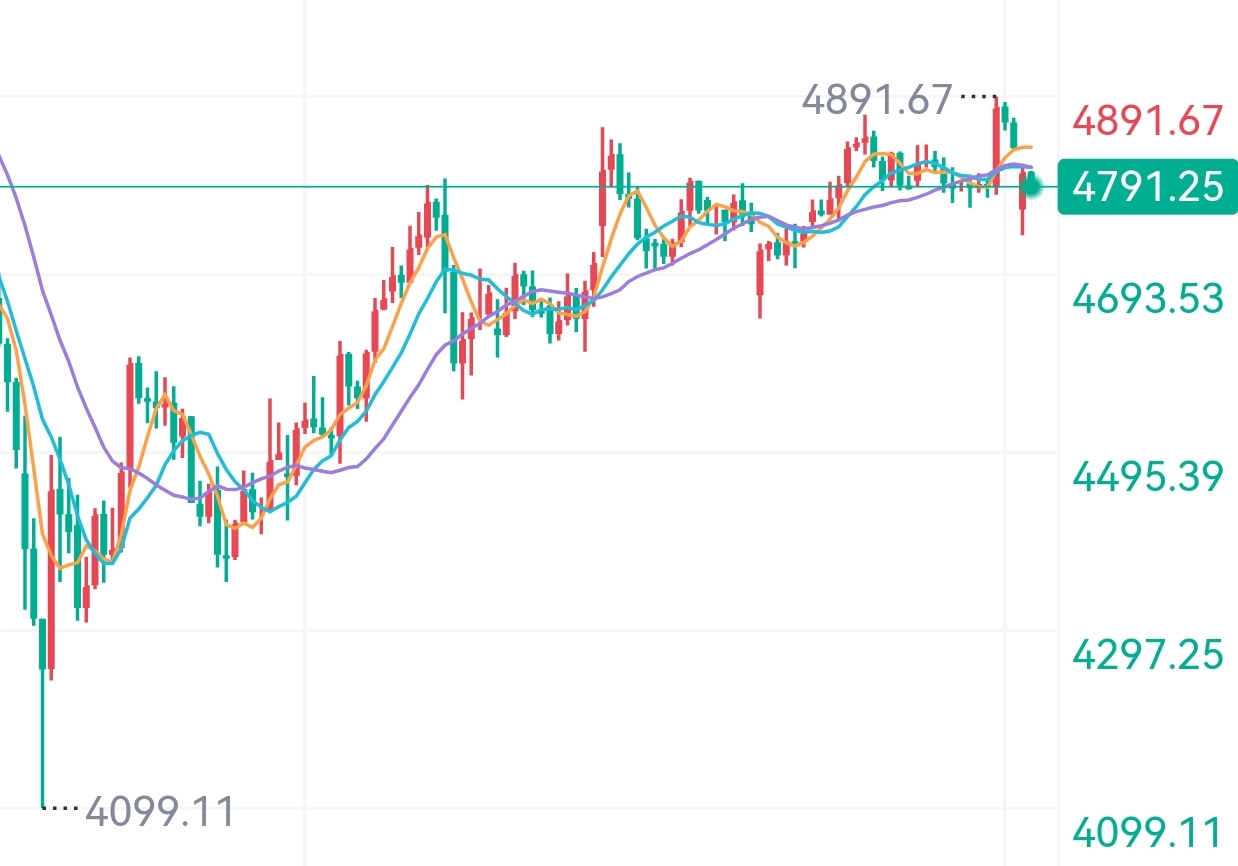
From a technical perspective, the daily uptrend channel remains intact, with the 5-day, 10-day, and 20-day moving averages still in bullish alignment, suggesting a mid-term bullish bias. However, there is significant resistance in the $4870-$4890 range, which has proven difficult to hold after multiple attempts, indicating that bulls currently lack the strength to push higher. If this range is broken, we could see levels of $4910-$5000; on the other hand, should prices drop, the 20-day moving average around $4650 provides strong support. The 4-hour Bollinger Bands are tightening, with price action hovering near the middle band, while the MACD's red bars are shortening and RSI is leaning bearish, indicating short-term volatility. Key levels to watch are the upper Bollinger Band at $4865-$4870 and the lower band at $4765-$4750; whichever side sees a breakout with volume will dictate the next move. On the hourly chart, moving averages are crossing downwards, and consecutive bearish candles are engulfing the bullish ones, indicating a downward shift. Short-term resistance is seen at $4850, while support is at $4730; a break below here could test the strong support at $4650. Overall, my short-term trading strategy for gold today is to primarily focus on shorting on rebounds while considering buying on dips, with short-term resistance to watch at $4850-$4880 and support at $4730-$4680.
On Monday morning during the Asian session, oil prices rebounded over 7%, with WTI crude fluctuating around $88.1 per barrel. The Iranian speaker cautioned that trading oil based on emotions is as unreliable as hedging against US Treasury risks. Last Friday, international oil prices plummeted nearly 9% after Iran announced it would open the Strait of Hormuz during the ceasefire, and there were positive developments in US-Iran negotiations. Brent crude dropped 9.07% to $90.38 per barrel, while WTI crude fell 11.45% to $83.85 per barrel, marking the largest single-day drop since April 8.
Looking at the crude oil daily chart, prices have broken below the moving average system, indicating a shift in mid-term direction. The trend is alternating back and forth, currently leaning towards downward. The MACD is opening downwards from a high position, signaling strengthening bearish momentum, and a mid-term correction from the highs is highly probable. In the short-term (1H), crude oil has reversed upwards, recovering a significant portion of last Friday's losses. Prices have breached the moving averages, changing the short-term direction as well. The MACD has crossed upwards from a low position, indicating increasing bullish strength; the morning trend is leaning towards a rise, and it may continue to push upwards today, testing 95.40. Overall, my trading strategy for crude oil today is to primarily focus on buying on dips while also considering shorting on rebounds. Watch for short-term resistance in the range of 91.5-94.0 and support around 83.5-80.0.#黄金 $XAU