Gold Latest Market Trend Analysis:
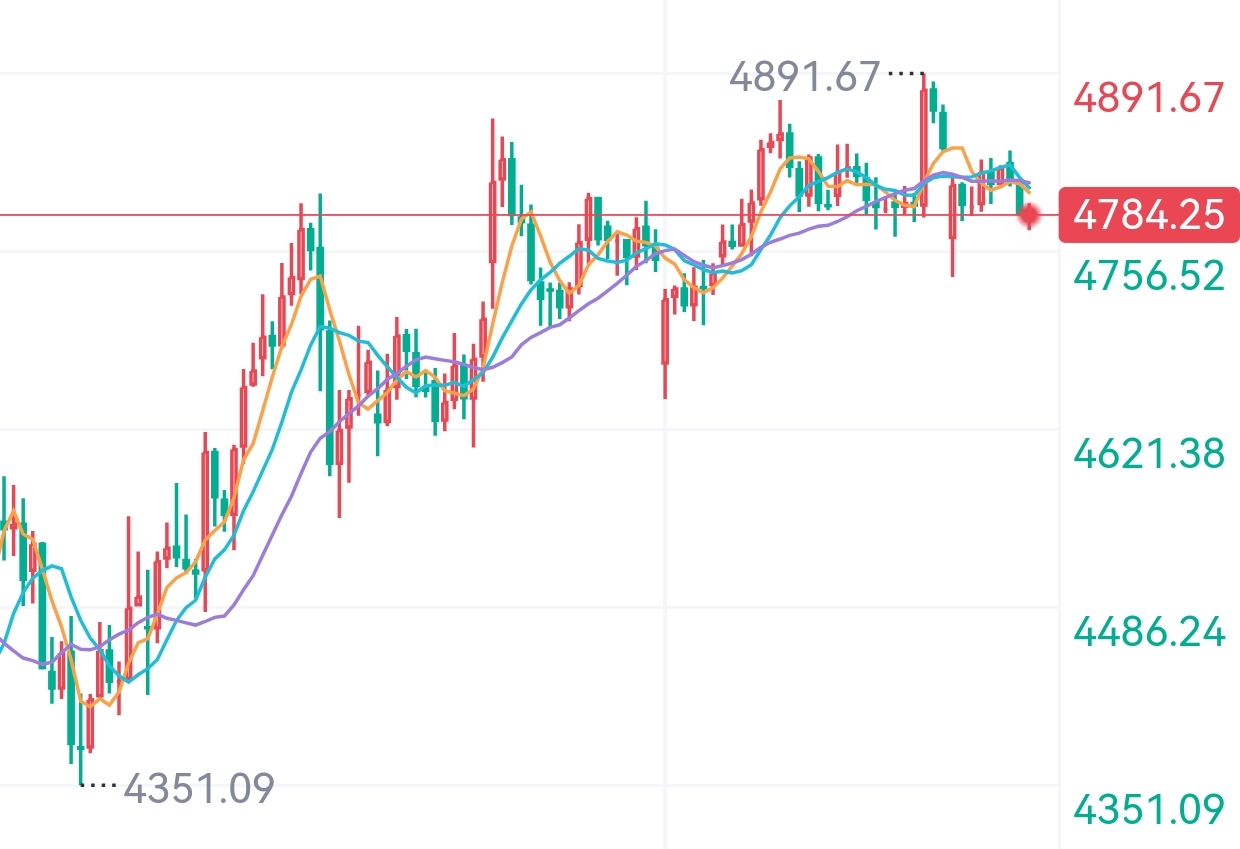
On Tuesday, after the European market opened, spot gold fell slightly, fluctuating around $4780 per ounce. Yesterday, gold was very volatile, first falling and then rising. The price of gold once dropped to $4737.04, but after that, it slowly rose back. The global financial market is very tense now, and gold, as a safe-haven asset, has its price fluctuations affecting everyone's heart. On Monday (April 20), gold showed a clear V-shaped reversal, dropping to a one-week low during the session, and then rebounding strongly, which is consistent with what Lao Yu mentioned in yesterday's article. It ultimately closed at $4820.63, only down about 0.28% for the day.
How's gold looking in the short term? It's all about whether the Middle East talks can reach a deal. US Vice President Vance is waiting for Iran to come to the table, but Iran hasn't made a clear statement yet, although it's likely they will. Iran's demands are straightforward: the US needs to lift the maritime blockade and cancel sanctions, but the US is standing firm—no negotiations, no lifting of the blockade. The conditions on both sides are completely opposed, making it tough to find common ground. For gold and silver, as long as the talks kick off, even if it's just a formality, we can expect a slight uptick in the short term; however, if Iran outright rejects or the talks collapse, tensions will spike again, causing gold to drop immediately. The market is swinging between risk-off sentiment and negotiation expectations, with a fierce tug-of-war between bulls and bears. Keep an eye on the Middle East situation and the US retail sales data for March on Tuesday.
On the weekly chart, gold has risen for four consecutive weeks, with the MACD indicator positioned above the zero line. Although there's been some back-and-forth at high levels recently, the overall uptrend remains intact. Currently, gold prices are running above the 5-week moving average and below the 10-week moving average, indicating a short-term consolidation phase. After this period of adjustment, we’ll need to see if it can break through either 4858 or 4710. The daily chart also shows high-level oscillation, with the 24-day and 38-day moving averages tangled together, showing a near balance between bulls and bears. Gold prices are battling around the $4800 mark, neither stabilizing nor breaking down, and the KDJ indicator is in the middle range, indicating the market is waiting for a signal. If it can hold above $4800, there’s a chance for continued gains; if it drops below, further declines are likely.
On the 4-hour chart, gold is oscillating between 4730 and 4830, with the Bollinger Bands flattening, indicating limited volatility; a direction choice is imminent. The MACD is crossing near the zero line, with bulls and bears frequently swapping places. In this kind of market, don't blindly chase the highs or lows; wait for a breakout from the range to trade with the trend. If it breaks above 4830, go long; if it drops below 4730, be cautious of a continued pullback. Overall, today's short-term trading strategy for gold, as advised by Lao Yu, is to primarily look for short opportunities on rebounds, with long trades on pullbacks being secondary. Key resistance levels are 4810-4830 above, and 4735-4715 support below.
Latest crude oil market trend analysis:
On Tuesday, after the European session opened, oil prices pulled back slightly, with WTI crude dropping over 1%, now hovering around $86.25 per barrel, hitting a low of $85.50 at the open. On Monday, oil prices surged, with Brent crude rising by 4.9% to $67.32 per barrel and WTI crude up 5.1% to $63.84 per barrel, marking the largest single-day gain in nearly two weeks. This spike is mainly due to heightened tensions between the US and Iran, raising concerns about the safety of shipping in the Strait of Hormuz, coupled with potential supply issues from some oil-producing countries in the Middle East, which has driven short-term bullish sentiment.
From the daily chart, oil prices have broken below the moving averages, signaling a shift in the medium-term trend. The price action has been a continuous decline, leaning bearish. The MACD is opening downwards from a high position, and bearish momentum is growing stronger, suggesting a higher probability of a correction from these high levels in the medium term. On the short-term 1-hour chart, after a reversal, oil prices are in a narrow range, with bulls and bears locked in a stalemate, favoring an upward rhythm. The MACD is operating near the zero line, with intense competition between bulls and bears, indicating a good chance for a slight uptick in oil prices today. Overall, today's trading strategy for oil, as suggested by Lao Yu, is to primarily look for long opportunities on pullbacks, with short trades on rebounds being a secondary focus. Key resistance levels are 88.8-91.0 above, and 83.5-80.5 support below.#黄金 $XAU