Latest trend analysis for gold
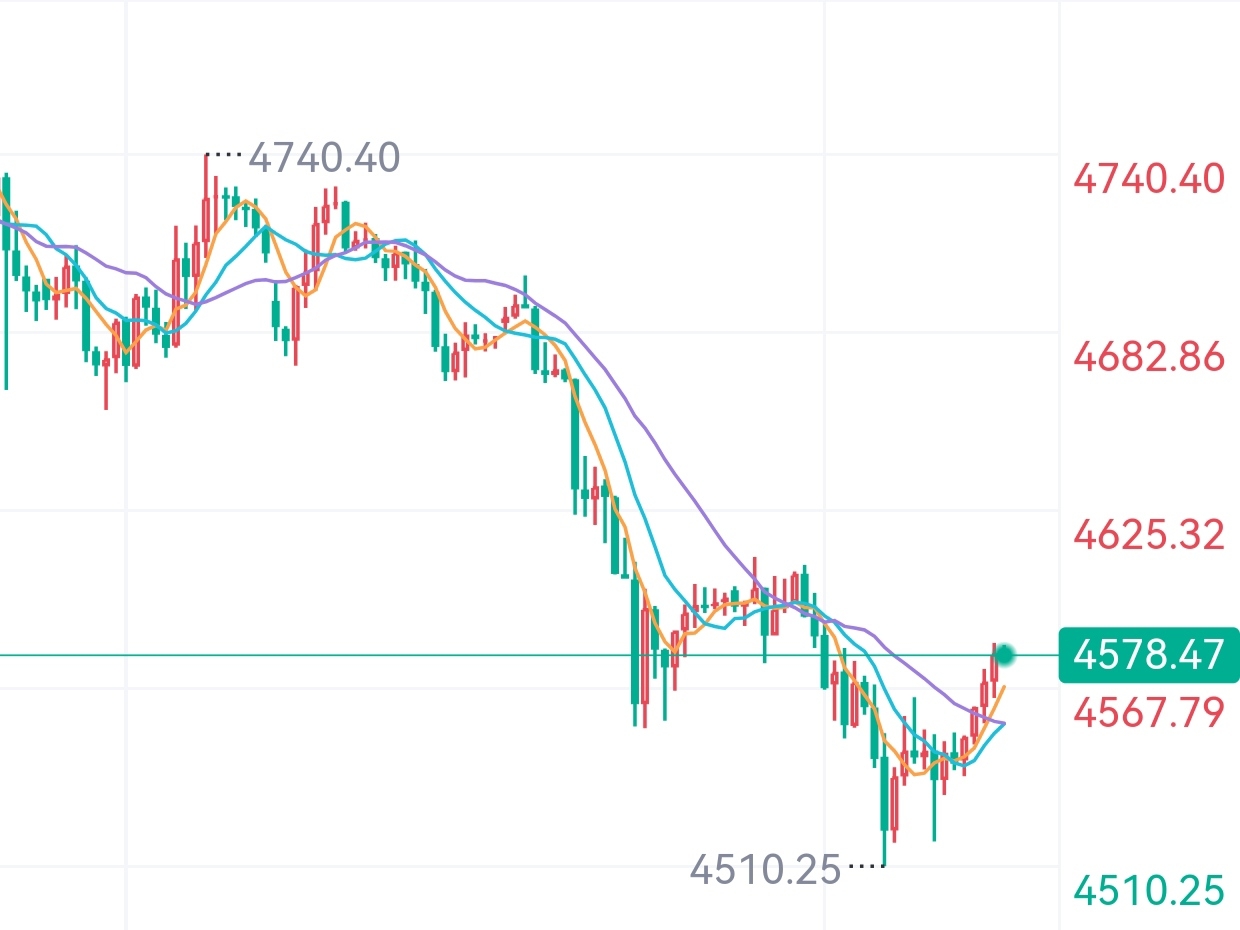
On Thursday morning during the Asian session, spot gold is experiencing slight fluctuations upwards, currently priced around $4578/oz. Everyone is awaiting today's interest rate decisions from the Bank of England and the European Central Bank, alongside several key economic data releases, while also keeping an eye on the ongoing developments in the Middle East. On Wednesday, gold continued its previous downtrend, with a daily drop of 1.17%, closing at $4543/oz. The intraday low hit $4510.21, marking the lowest point in nearly a month since late March. U.S. gold futures also fell, down 1%, closing at $4561.50. Gold has been weak for several days now; the market was previously optimistic, but now traders are becoming cautious and even starting to look bearish.
From the daily candlestick chart, gold has dropped from its previous high. Although there has been a slight rebound, the overall trend remains bearish. Currently, we've seen three consecutive bearish candles, the KDJ indicator is moving downwards, and the MACD shows signs of a downward turn. The downward momentum is strengthening, and in the short term, gold is likely to continue facing downward pressure. For short-term price action, watch the 5-day and 10-day moving averages as resistance, and above that, the mid-line of the Bollinger Bands will be a key barrier.
On the 4-hour chart for gold, the downward channel remains intact, with consecutive bearish candles forming, and the price running close to the lower Bollinger Band. The bears are fully in control of the market. The MACD is showing diminishing green bars, and the KDJ indicator is clustered at low levels, indicating a potential for a minor rebound but with limited upside potential. Key resistance for any rebound is between $4585 and $4600. Currently, we need to keep an eye on whether the price breaks below $4555; if it does, we could see a move towards $4404, opening up further downside potential, and even the previous low of $4099 could be breached. If this support holds, gold is likely to either consolidate or bounce slightly. Overall, today’s short-term trading strategy suggests focusing on shorting on any upward rebounds while cautiously looking to go long on dips. The short-term resistance to watch above is between $4610 and $4640, while support below is between $4510 and $4480.
Latest trend analysis for crude oil.
On Thursday morning during the Asian trading session, West Texas Intermediate crude oil is hovering around $107.10 per barrel, following a nearly 9% surge on Wednesday. This spike is mainly due to the collapse of US-Iran negotiations, raising concerns about prolonged disruptions to Middle Eastern oil supply. Coupled with a larger-than-expected drop in EIA crude oil inventories, there’s a dual bullish effect driving up oil prices. By Wednesday's close, Brent crude surged over 6%, settling at $118.03 per barrel, with an intraday peak of $120; WTI closed at $106.88 per barrel, both reaching new highs in recent weeks.
From the daily chart, crude oil prices have fallen below the moving average support, indicating a shift in the medium-term trend. The current market is oscillating between gains and losses, with a short-term bias leaning towards a pullback. The MACD is turning down from high levels, indicating strengthening bearish momentum, suggesting that the medium-term trajectory may involve fluctuations at high levels before a decline.
From the 1-hour short-term chart, crude oil has broken out of its previous consolidation range and is on an upward trajectory, supported by the moving averages. The short-term trend is bullish. However, the MACD is forming a death cross at high levels, indicating a weakening of bullish momentum. In the early session, oil prices have slightly pulled back, and following the pattern of alternating gains and losses, there is still a good probability for continued upward movement today. Overall, the trading strategy for crude oil suggests focusing on going long on any pullbacks while looking for short opportunities on rebounds. Key resistance to watch above is between $115.0 and $120.0, while support below is between $102.0 and $97.0.#黄金 $XAU