Latest trend analysis on gold
During the Thursday Asian session, spot gold is holding steady in a narrow range, currently quoted at around $4695 per ounce. On Wednesday, gold experienced a strong rally, breaking past the high from April 27, with a daily increase approaching 3%, successfully breaking out of the previous long-term sideways consolidation. This surge in gold prices is primarily driven by a significant easing of geopolitical tensions. Reports suggest that the US and Iran are about to finalize a ceasefire memorandum, aiming to end the conflict in the Gulf region, with plans for in-depth negotiations to follow. The calming of the situation has boosted market risk-off sentiment, directly propelling gold prices higher.
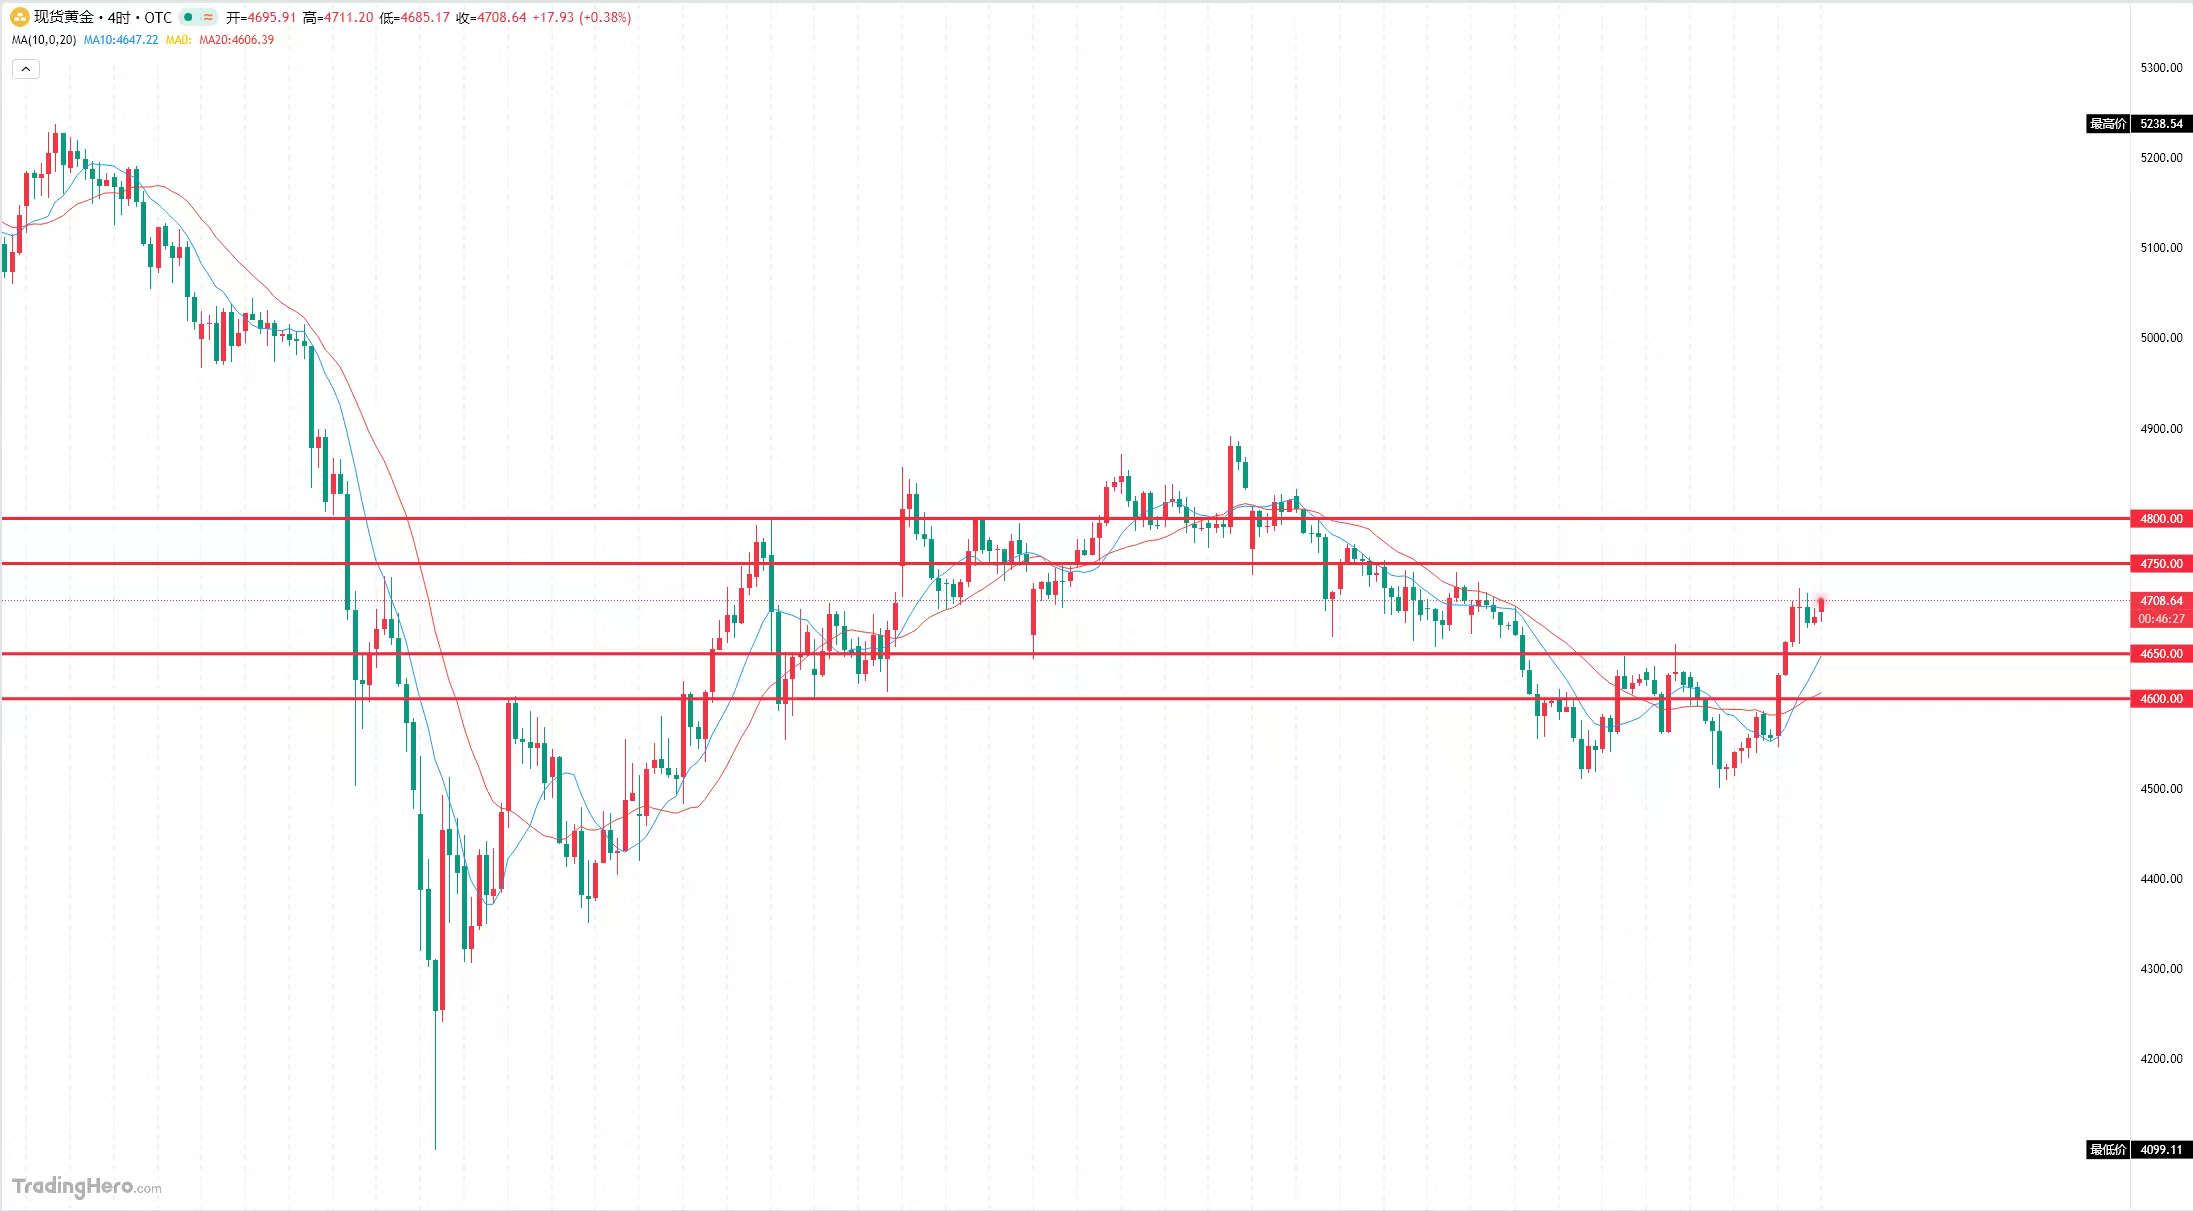
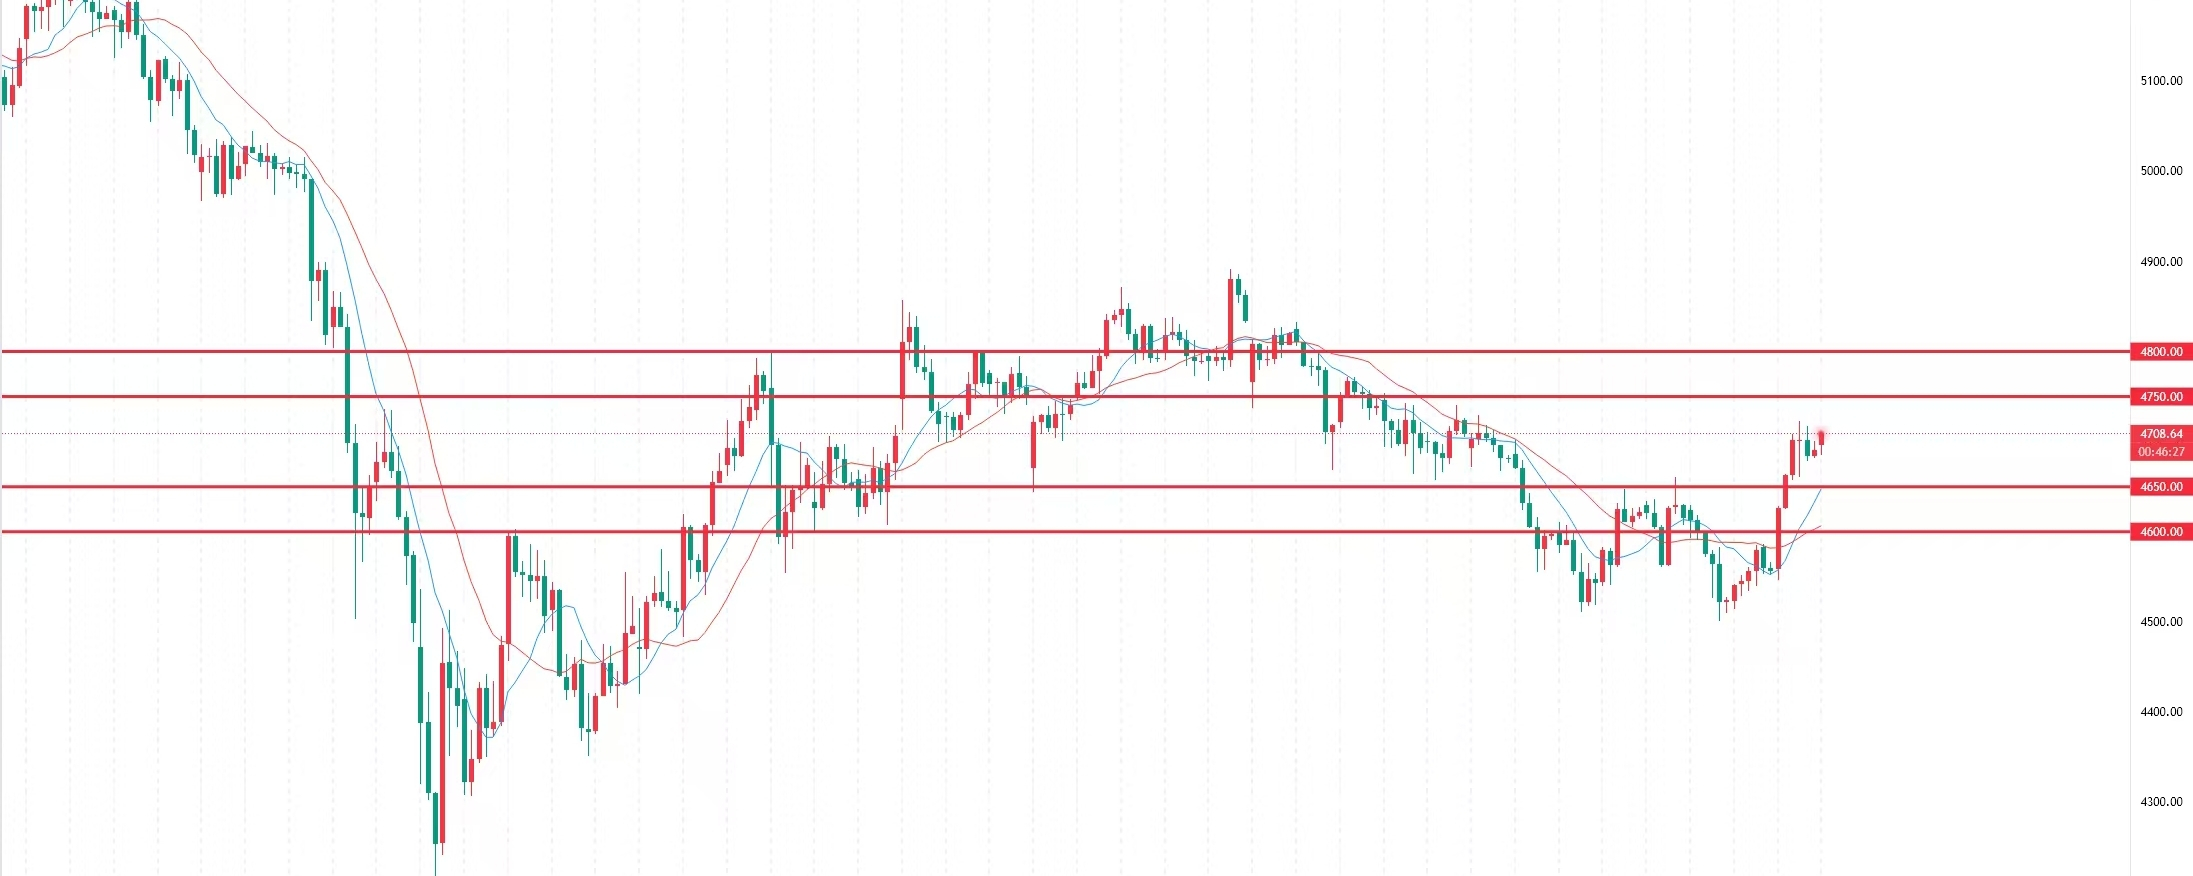
From a market structure perspective, gold has effectively broken out of the previous consolidation range. The daily chart shows a strong bullish pattern forming, with short-term moving averages starting to turn upwards. Currently, it is facing resistance from the 5-day moving average on the weekly chart; only by firmly standing above the medium-term moving average can the upside potential be further unlocked. In the short term, we should first watch the 4720 resistance level. On the 4-hour chart, prices continue to run above the short-term moving averages, with a solid bullish arrangement. The Bollinger Bands are opening upwards, and gold prices are steadily rising on the middle band, with bullish momentum looking very solid. The MACD is maintaining a golden cross, with red bars steadily increasing, indicating that bullish momentum remains strong with no signs of weakening. In the short term, we maintain a strong upward bias supported by the 4680-4700 area, with the overall market favoring bulls. Any pullback provides a buying opportunity, especially paying attention to the breakout situation at the 4720 level.
Support levels are structured in three tiers: the first support at 4580-4600, acting as a key defensive zone for recent pullbacks; the second support at 4550, which is a densely traded area from previous rallies and an important lifeline for this uptrend; strong support also sits around 4550, covering previous lows and institutional holding cost areas, representing the last key defensive line for bulls.
Resistance levels are also categorized into three tiers: the first resistance at 4720, which combines recent highs and short-term pressure points, represents the core battleground for bulls and bears; the second resistance at 4750 is an important psychological level compounded by previous highs, and a successful breakout here will further unlock upside potential; strong resistance at 4800 is a key pressure point favored by industry players, and only a significant breakout can establish a medium to long-term uptrend. In summary, for today’s trading strategy, I recommend focusing on buying during pullbacks as the main strategy, with shorting on spikes as a secondary strategy. The short-term focus should be on the resistance between 4750-4800, while the support levels to watch below are between 4650-4600.
Latest trend analysis for crude oil.
On Thursday, the Asian market received positive news regarding US-Iran negotiations, with both sides likely to reach a written reconciliation agreement. Iran may provide an official response within 48 hours. Expectations of de-escalating geopolitical tensions have directly suppressed the risk premium on oil, leading to a significant drop in oil prices on Wednesday, with WTI crude falling over 6% in a single day, currently quoted around $95.88 per barrel. Oil prices hit a two-week low on Wednesday, with Brent crude plummeting 7.83% to close at $101.27 per barrel, briefly falling below the 100 psychological level for the first time since April 22; WTI crude also dropped 7.03%, closing at $95.08 per barrel.
From a daily chart perspective, oil prices have consecutively broken below several moving averages, indicating a turning point in the medium-term trend, transitioning into a weak market structure after the bull-bear switch. The MACD has formed a death cross at high levels and continues to decline, with bearish momentum accumulating and strengthening, likely extending the high-level pullback adjustment rhythm. The hourly chart shows short-term fluctuations needing a rebound, temporarily stabilizing above the 100 level, with short-term moving averages re-establishing a bullish arrangement. The morning session might see slight rebound potential, while the downward adjustment force remains limited, maintaining a wide-ranging volatile pattern overall today. In summary, for today’s trading strategy, I suggest focusing on buying during pullbacks as the main strategy, with shorting on rebounds as a secondary strategy. The short-term resistance to watch above is between 100.0-105.0, while the support levels to keep an eye on below are between 90.0-85.0.#黄金 $XAU