Latest gold market trend analysis:
On Monday morning in the Asian market, spot gold opened slightly lower, maintaining a downtrend and currently trading around $4898/oz. The gold price continues to oscillate around the $4700/oz level. The situation in the Middle East, particularly regarding Iran, remains volatile. Over the weekend, President Trump rejected Iran's latest response to the ceasefire proposal in the Middle East, keeping market sentiment reactive to breaking news, which causes price fluctuations to closely follow these developments. Last Friday, spot gold saw a slight increase, successfully closing the week in the green, with prices rising by 0.6% to $4715.18/oz. Overall, gold accumulated a 2.15% gain last week, primarily driven by optimistic expectations regarding easing tensions in the U.S.-Iran conflict, gradually alleviating inflation concerns and worries about the Federal Reserve's interest rate policy.
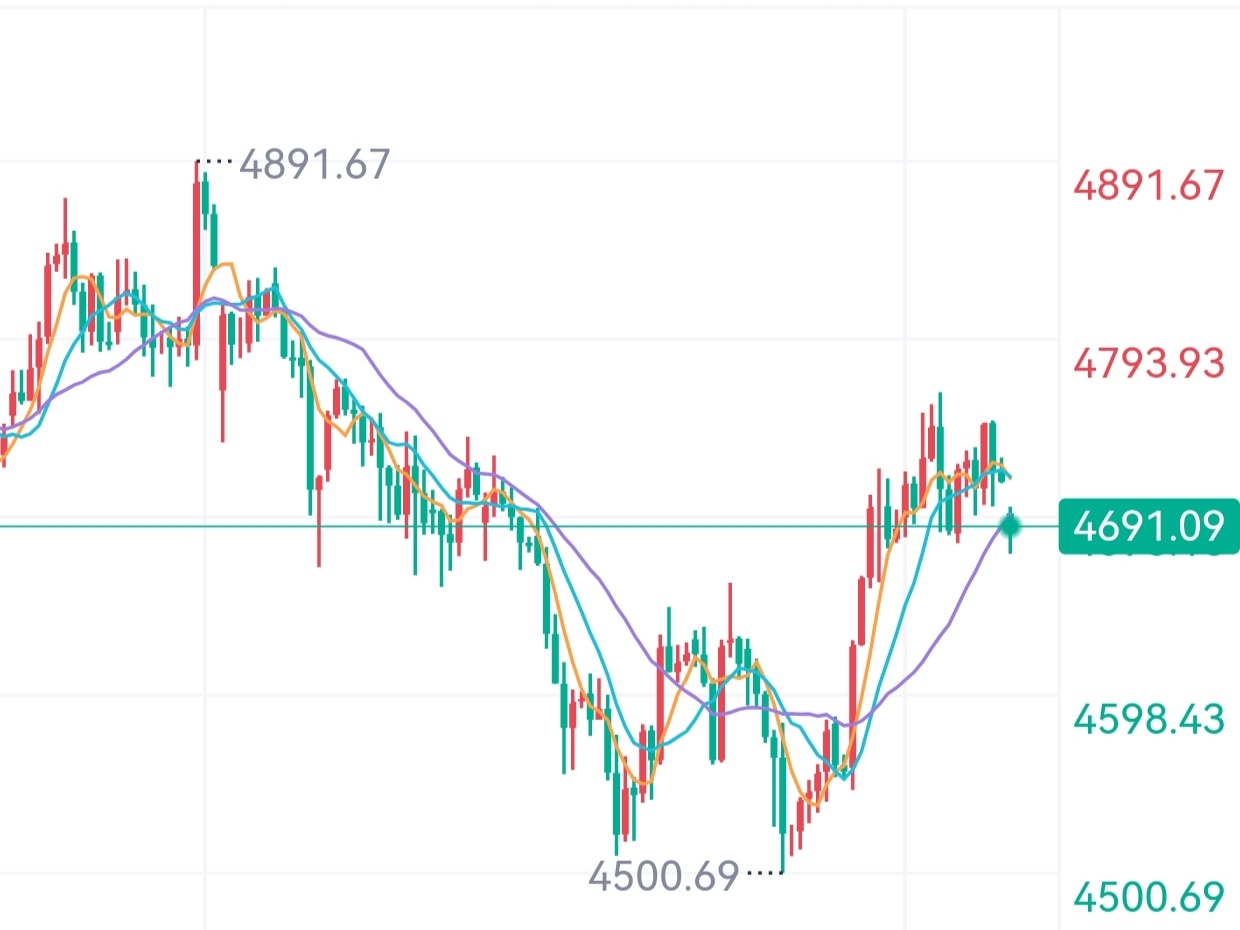
From a daily chart perspective, gold closed with a small bullish candle on Friday, with prices firmly above the 5-day and 10-day moving averages, forming a strong support zone. After testing the low of $4500, gold began a consecutive rebound, gradually building a bullish trend structure with higher lows and higher highs. Following a slight increase, the candlestick pattern shows a high-level consolidation. The MACD indicator's green bars continue to shrink, with the fast and slow lines moving closer to the zero axis, indicating a sustained reduction in bearish momentum; however, the key resistance above remains significant. The core support zone is located between $4680-4700, which serves as both a short-term dense moving average support and a trend support line for this rebound. The key resistance above is at $4750-4780; a decisive breakthrough here would open up further upside above $4800.
From the 4-hour chart perspective, after a dip, gold prices did not establish a unilateral trend, maintaining a narrow range between $4670-4764. Prices are stabilizing near the middle band of the Bollinger Bands, which are gradually tightening, indicating that the volatility range of the short-term market is narrowing, and a trend change is imminent. The 4-hour moving averages are intertwined and flat, with short-term bullish and bearish forces in relative equilibrium; however, the overall price center is slowly rising, making the oscillating bullish pattern very clear. Indicators show a slight bearish divergence in the MACD, while the KDJ indicator operates in a neutral zone with no clear overbought or oversold signals; the short-term market is likely to exchange time for space, continuously digesting previous gains and preparing for a breakout opportunity. Current key support at the 4-hour level is at $4690, with key resistance at $4750, maintaining an oscillating trend until a breakout occurs.
The 1-hour level shows that gold prices peaked at $4764.7 on Thursday before pulling back. Friday saw consolidation as the market gathered momentum, with a second attempt at $4750 encountering resistance and pulling back. Bullish momentum is weakening, but downside space is quite limited. It is expected that the short-term trend will continue to oscillate at high levels, waiting for news or capital to break the consolidation range. Core support is at $4680-4700, with secondary support at $4650; core resistance is at $4750-4780, with strong resistance at the $4800 round number.
In the short term, gold is likely to maintain a range-bound movement between $4680-4750, with a directional choice for a trend change approaching. If it can stabilize above $4750, it will reignite the bullish trend, further aiming for the $4800-4850 range. Conversely, if it breaks below the critical support at $4680, it will initiate a phase of correction, potentially retracing to the $4630-4600 range. Overall, today's short-term trading strategy for gold, as suggested by Lao Yu, is to focus primarily on short positions on rebounds, supplemented by long positions on dips, with short-term key resistance at $4730-4765 and key support at $4660-4630.
Latest market trend analysis for crude oil:
On Monday morning in the Asian market, uncertainty surrounding the situation in Iran is heating up. Over the weekend, President Trump rejected Iran's latest response to the ceasefire proposal in the Middle East, and this news continues to stir the market. As a result, crude oil opened significantly higher due to geopolitical risks. WTI crude oil opened up nearly 3%, currently trading around $98.42/barrel, with the potential to test the $100/barrel mark today. Previously, the mutual airstrikes between the U.S. and Iran raised concerns about shipping in the Strait of Hormuz. Last Friday, Brent crude oil surged by 3% at one point, but the gains gradually narrowed as traders bet on a long-term ceasefire. Ultimately, Brent crude closed up 1.23% at $101.29 per barrel, while WTI crude rose 0.64% to $95.42, but both major crude futures fell over 6% last week.
Analyzing from the daily chart level, oil prices are weaving through the moving average system, with the medium-term major trend entering a consolidation phase. According to the alternating rhythm of primary and secondary trends, the current two-month consolidation in crude oil is a secondary rhythm, while the medium-term subjective trend still leans upwards. Currently, the MACD indicator operates near the zero axis, with bullish momentum showing signs of exhaustion; the medium-term trend is still expected to be primarily oscillating.
In the short term, the 1-hour chart shows crude oil maintaining a low-level consolidation with a weak rebound pattern. Prices are crossing the moving average system, and the short-term objective trend is sideways. The main trend direction is temporarily down. Meanwhile, bearish momentum is showing signs of gradual weakening, and it is expected that the crude oil trend at the beginning of the week will mainly focus on low-level consolidation. Overall, today's trading strategy for crude oil, as suggested by Lao Yu, is to primarily look for long positions on dips, with short positions on rebounds as a supplement. Short-term resistance is expected at the 105.0-110.0 range, while support is seen at 93.0-88.0.#黄金 $XAU