Recently, too many friends have been trading contracts, so I specifically wrote an article on how to significantly improve contract win rates using indicators for everyone's reference.
1. There are many friends who can open orders 24 hours a day; this behavior is almost like giving away money. The purpose of contracts is to make a stable profit strategy under controllable risks and relatively stable indicators, rather than to buy in with 100 times leverage and then become rich! Therefore, the timing of entering contracts is particularly important!
1: Do not open orders during periods of significant good or bad news, as the market is very chaotic at this time. Spot prices can fluctuate rapidly between 1-3%, and if you choose to gamble on the market, it is easy to be taken out by sudden spikes.
⑵: I generally choose to enter after a significant price fluctuation on the second bottom or after a high rise, because after the second wave of market movement, the fluctuations will gradually stabilize. The risk coefficient in the subsequent range is the lowest. The purpose of the contract is to implement the most suitable strategy in the smallest risk range.
⑶: Enter the market within the indicator range. As long as the indicator parameters do not meet my expectations, I will not open a position. This can be understood as entering the market within my strategy range and ignoring the market if it hasn’t reached my mental price level. Because while the contracts amplify leverage, the risk coefficient also increases, so self-discipline is very important. In summary, when the market stabilizes and the indicators are in place, the risk ratio can be reduced by 50%, and then trades can be executed.
2. Using indicators can increase the win rate.
⑴: MACD is a must-use indicator, a must! MACD is the most intuitive indicator reflecting current market sentiment. As shown in the figure, the risk of going long at the blue peaks is greater than going short, and similarly, the risk of going short at the red peaks is greater than going long. However, it doesn't mean you must short in the blue area and long in the red area.
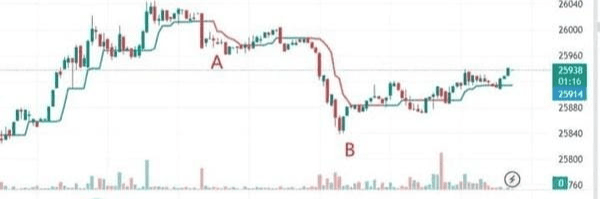 As shown in the figure: I will choose to long at point A's peak and also long at point B's peak. But I must remind everyone that MACD can reduce losses to a certain extent. No matter if you are going long or short at the peak, it is definitely more reasonable than blindly entering contracts or only looking at price levels. Because MACD's peaks will only show during the mid to late stages of a downtrend or uptrend, thus your entry price will be much more reasonable compared to other periods.
⑵: Use the HalfTrend indicator reasonably to judge trends; so far, I haven’t seen any analyst on the internet using HalfTrend. They generally rely on K-line charts. The advantage of HalfTrend is that it can judge whether the market is gradually rising or falling in a short-term market.
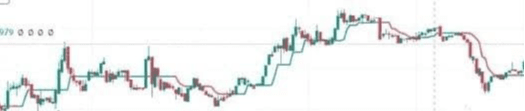 As shown in the figure: The red line of HalfTrend indicates a potential for high shorts, while the blue line suggests a potential for low longs. HalfTrend allows players who are confused about whether to long or short to make reasonable choices. For example, if the current trend has moved through two steps of the blue section, then choosing to long at a low position has a higher probability than shorting at a high position.
⑶: Use the RSI indicator to determine entry timing. RSI mainly reflects changes in price strength and speed.
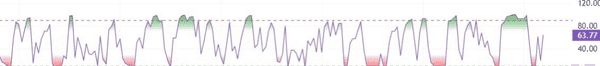
As shown in the figure: I generally short in the green area above the upper red line and go long in the red area below the bottom green line. That is: exceeding the upper red line indicates that the price has strengthened beyond my set parameter threshold, and there is a high probability of a pullback. Conversely, if the price is below the lower green line, I will go long, meaning the price has weakened to my set parameter threshold, thus the likelihood of a reversal is greater.
⑷: Combining the above three indicators, if the market can satisfy all three indicators simultaneously, the accuracy of market prediction is extremely high (astronomical figures).
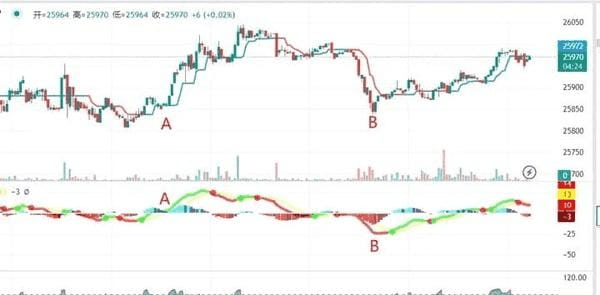
As shown in the figure, points A and B both meet the three conditions of the indicator parameters, and the accuracy rate in this range is very high. Next, I will share a screenshot of my trading over a month. Due to many fans helping me with stress testing, I won’t share the floating profit screenshots.
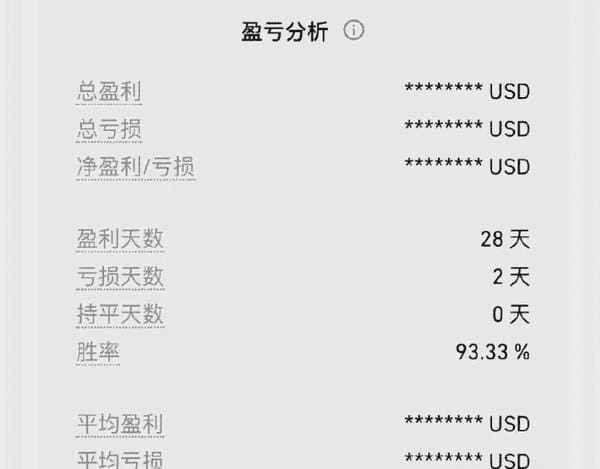
Currently, I have approximately 10 practical trades. My trading model can only control the profit rate to a maximum of around 3% under a 20x contract. Many trades I can't even rush in for.
Currently, I am continuing to test indicator parameters and constantly optimizing them. My expectation is that being able to stabilize around 5% would be considered an excellent trading model.
One more thing to tell everyone is that all indicator models apply differently based on the K-line indicators of different time frames. For example, the parameters set for my indicators can only be applied to 15-minute K-lines. If I want to use the 4-hour K-line indicator parameters, I need to retest and readjust them. Also, the strategies for ultra-short-term and medium-to-long-term are vastly different.
I am Little Egg Tart, a professional analyst and teacher, a mentor and friend on your investment journey! As an analyst, the most basic thing is to help everyone make money. I will help you resolve confusion and trapped positions, speaking with strength. When you are lost and don’t know what to do, follow Little Egg Tart; Little Egg Tart will guide you.
