Bitcoin recovery resurfaces above the lost $102k zone 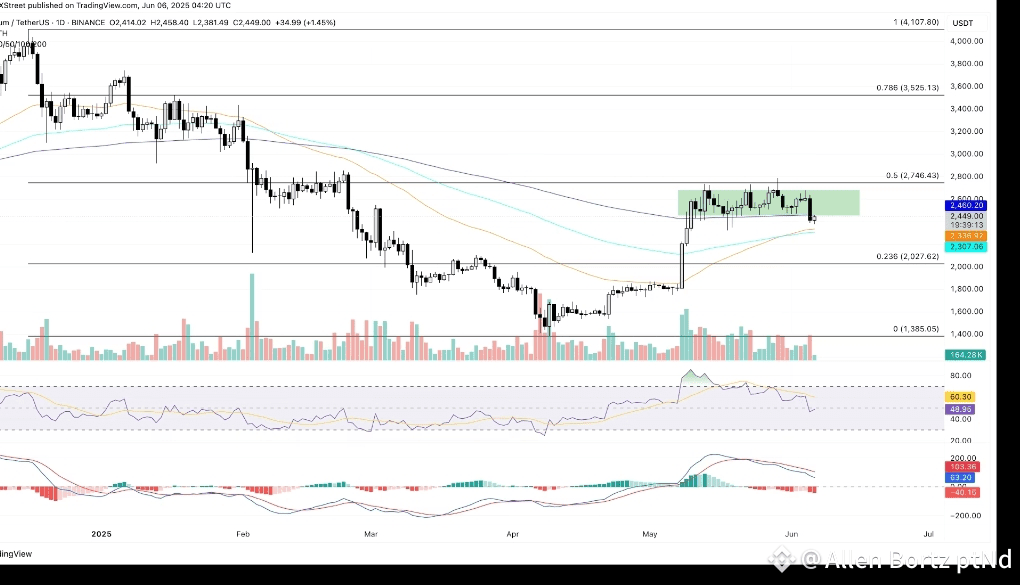
Bitcoin’s recovery is approaching 1.50% at press time on Friday, shrugging off the sudden 3% drop last night. As a bullish candle springs above the 50-day Exponential Moving Average (EMA) at $100,908, Bitcoin resurfaces above the $102,500 zone, which acted as a crucial support zone in May.
The persistent bullish failures to sustain an uptrend above $102,500 formed a head and shoulders pattern on the daily chart shared below. Bitcoin’s recovery on the day aims to invalidate the pattern if BTC closes above the zone.
However, the momentum indicators signal downside risk as the Moving Average Convergence/Divergence (MACD) shows a bearish trend with the average lines approaching the centre line. In addition, the RSI at 46 spikes towards the halfway line after the recent drop, signaling an overall decline in bullish momentum.
If Bitcoin's closing price holds above the $103,000 mark, it will mark a bear trap, resulting in a surge towards the all-time high at $111,980.
BTC/USDT daily price chart. Source: Tradingview
Conversely, sideline traders looking for a sell signal could find the 50-day EMA breakdown to be an entry spot. The next key support level is at the 100-day EMA at $96,757.
Ethereum range meltdown breaks below $2,500
Ethereum is up nearly 1.50% in the day at press time, after a decline of over 7% on Thursday, breaking below the 200-day EMA at $2,460, which had acted as the lower boundary of a consolidation range.
ETH’s intraday growth on Friday creates a bullish candle and attempts to reclaim the dynamic support to nullify the breakdown, as previously seen on May 18 and May 19. However, the previous closing prices were bound within the price range, marking this potential attempt as a bear trap.
Similar to Bitcoin, the momentum indicators project increased downside risk as the MACD and its signal line remain in a freefall, while the RSI at 48 prolongs the declining trend below the halfway line.
If Ethereum bounces above the 200-day EMA at $2,460, it could rise towards the range’s upper ceiling near $2,700.
ETH/USDT daily price chart. Source: Tradingview
However, a closing below the 100-day EMA at $2,307 could extend ETH’s losses towards $2,000.
XRP’s recovery holds above the 200-day EMA
Ripple’s XRP token shows a similar recovery on Friday as Bitcoin and Ethereum in attempts to shrug off last night’s drop. Holding above the 200-day EMA near the $2 psychological support, XRP eyes to reclaim the lost $2.13 level.
The momentum indicators in XRP mirror those of Bitcoin and Ethereum, signaling a loss of bullish momentum as the gains made earlier this week deplete.
A daily close above $2.13 could test the converging 50-day and 100-day EMAs near $2.25.
XRP/USDT daily price chart. Source: Tradingview
If XRP breaks below the 200-day EMA, it could extend the declining trend to the $1.79 support level, the lowest closing price in April.
Information on these pages contains forward-looking statements that involve risks and uncertainties. Markets and instruments profiled on this page are for informational purposes only and should not in any way come across as a recommendation to buy or sell in these assets. You should do your own thorough research before making any investment decisions. FXStreet does not in any way guarantee that this information is free from mistakes, errors, or material misstatements. It also does not guarantee that this information is of a timely nature. Investing in Open Markets involves a great deal of risk, including the loss of all or a portion of your investment, as well as emotional distress. All risks, losses and costs associated with investing, including total loss of principal, are your responsibility. The views and opinions expressed in this article are those of the authors and do not necessarily reflect the official policy or position of FXStreet nor its advertisers.
RELATED CONTENT
Gemini hints at IPO following confidential filing with SEC
Gemini hints at IPO following confidential filing with SEC
Ethereum Price Forecast: ETH tests key resistance amid rising exchange inflows
Ethereum Price Forecast: ETH tests key resistance amid rising exchange inflows
Ripple Price Prediction: XRP offers multiple buy signals targeting $2.50
Ripple Price Prediction: XRP offers multiple buy signals targeting $2.50
Metaplanet announces $5.4 billion share offering to boost Bitcoin acquisition, targets 210K BTC by 2027
Metaplanet announces $5.4 billion share offering to boost Bitcoin acquisition, targets 210K BTC by 2027
AI Tokens to Watch: VIRTUAL, GRASS surge ahead of the weekend
AI Tokens to Watch: VIRTUAL, GRASS surge ahead of the weekend
Cryptocurrencies Price Prediction: Ripple, Fartcoin & Cryptos – American Wrap 06 June
Cryptocurrencies Price Prediction: Ripple, Fartcoin & Cryptos – American Wrap 06 June
Bitcoin Price Forecast: BTC could slump to $100K amid Trump-Musk tussle
Bitcoin Price Forecast: BTC could slump to $100K amid Trump-Musk tussle
Fartcoin extends rebound, decoupling from broader market flash crash amid potential listing on Coinbase
Fartcoin extends rebound, decoupling from broader market flash crash amid potential listing on Coinbase
Crypto Today: Bitcoin, Ethereum, XRP wobble as recession fears resurface
Crypto Today: Bitcoin, Ethereum, XRP wobble as recession fears resurface
Cryptocurrencies Price Prediction: Solana, Bitcoin & LATAM – European Wrap 6 June
Cryptocurrencies Price Prediction: Solana, Bitcoin & LATAM – European Wrap 6 June


