If you have started trading, you have probably heard the name RSI. But many do not understand how RSI works. Today, we will learn in simple terms how to use RSI and how to make trading decisions with it.
🔥 What is RSI?
RSI (Relative Strength Index) is a popular trading indicator that helps to determine whether a coin or asset is overbought or oversold.
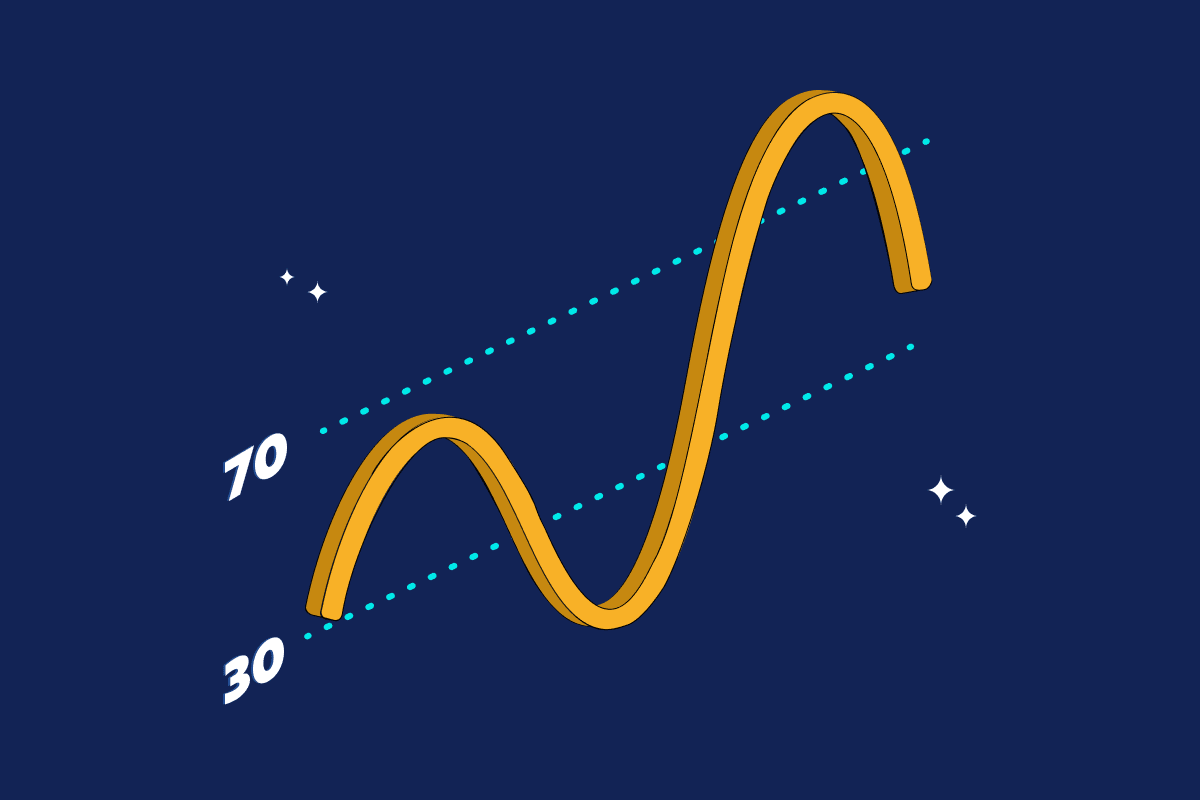
🔹 RSI values range between 0 to 100.
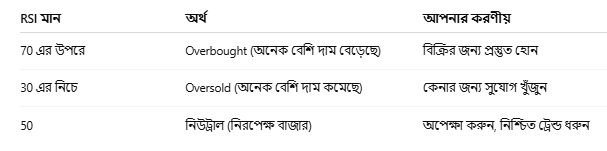
🔹 If RSI goes above 70, it indicates that the asset is overbought — meaning the price may decrease.
🔹 If RSI goes below 30, it indicates that the asset is oversold — meaning the price may increase.

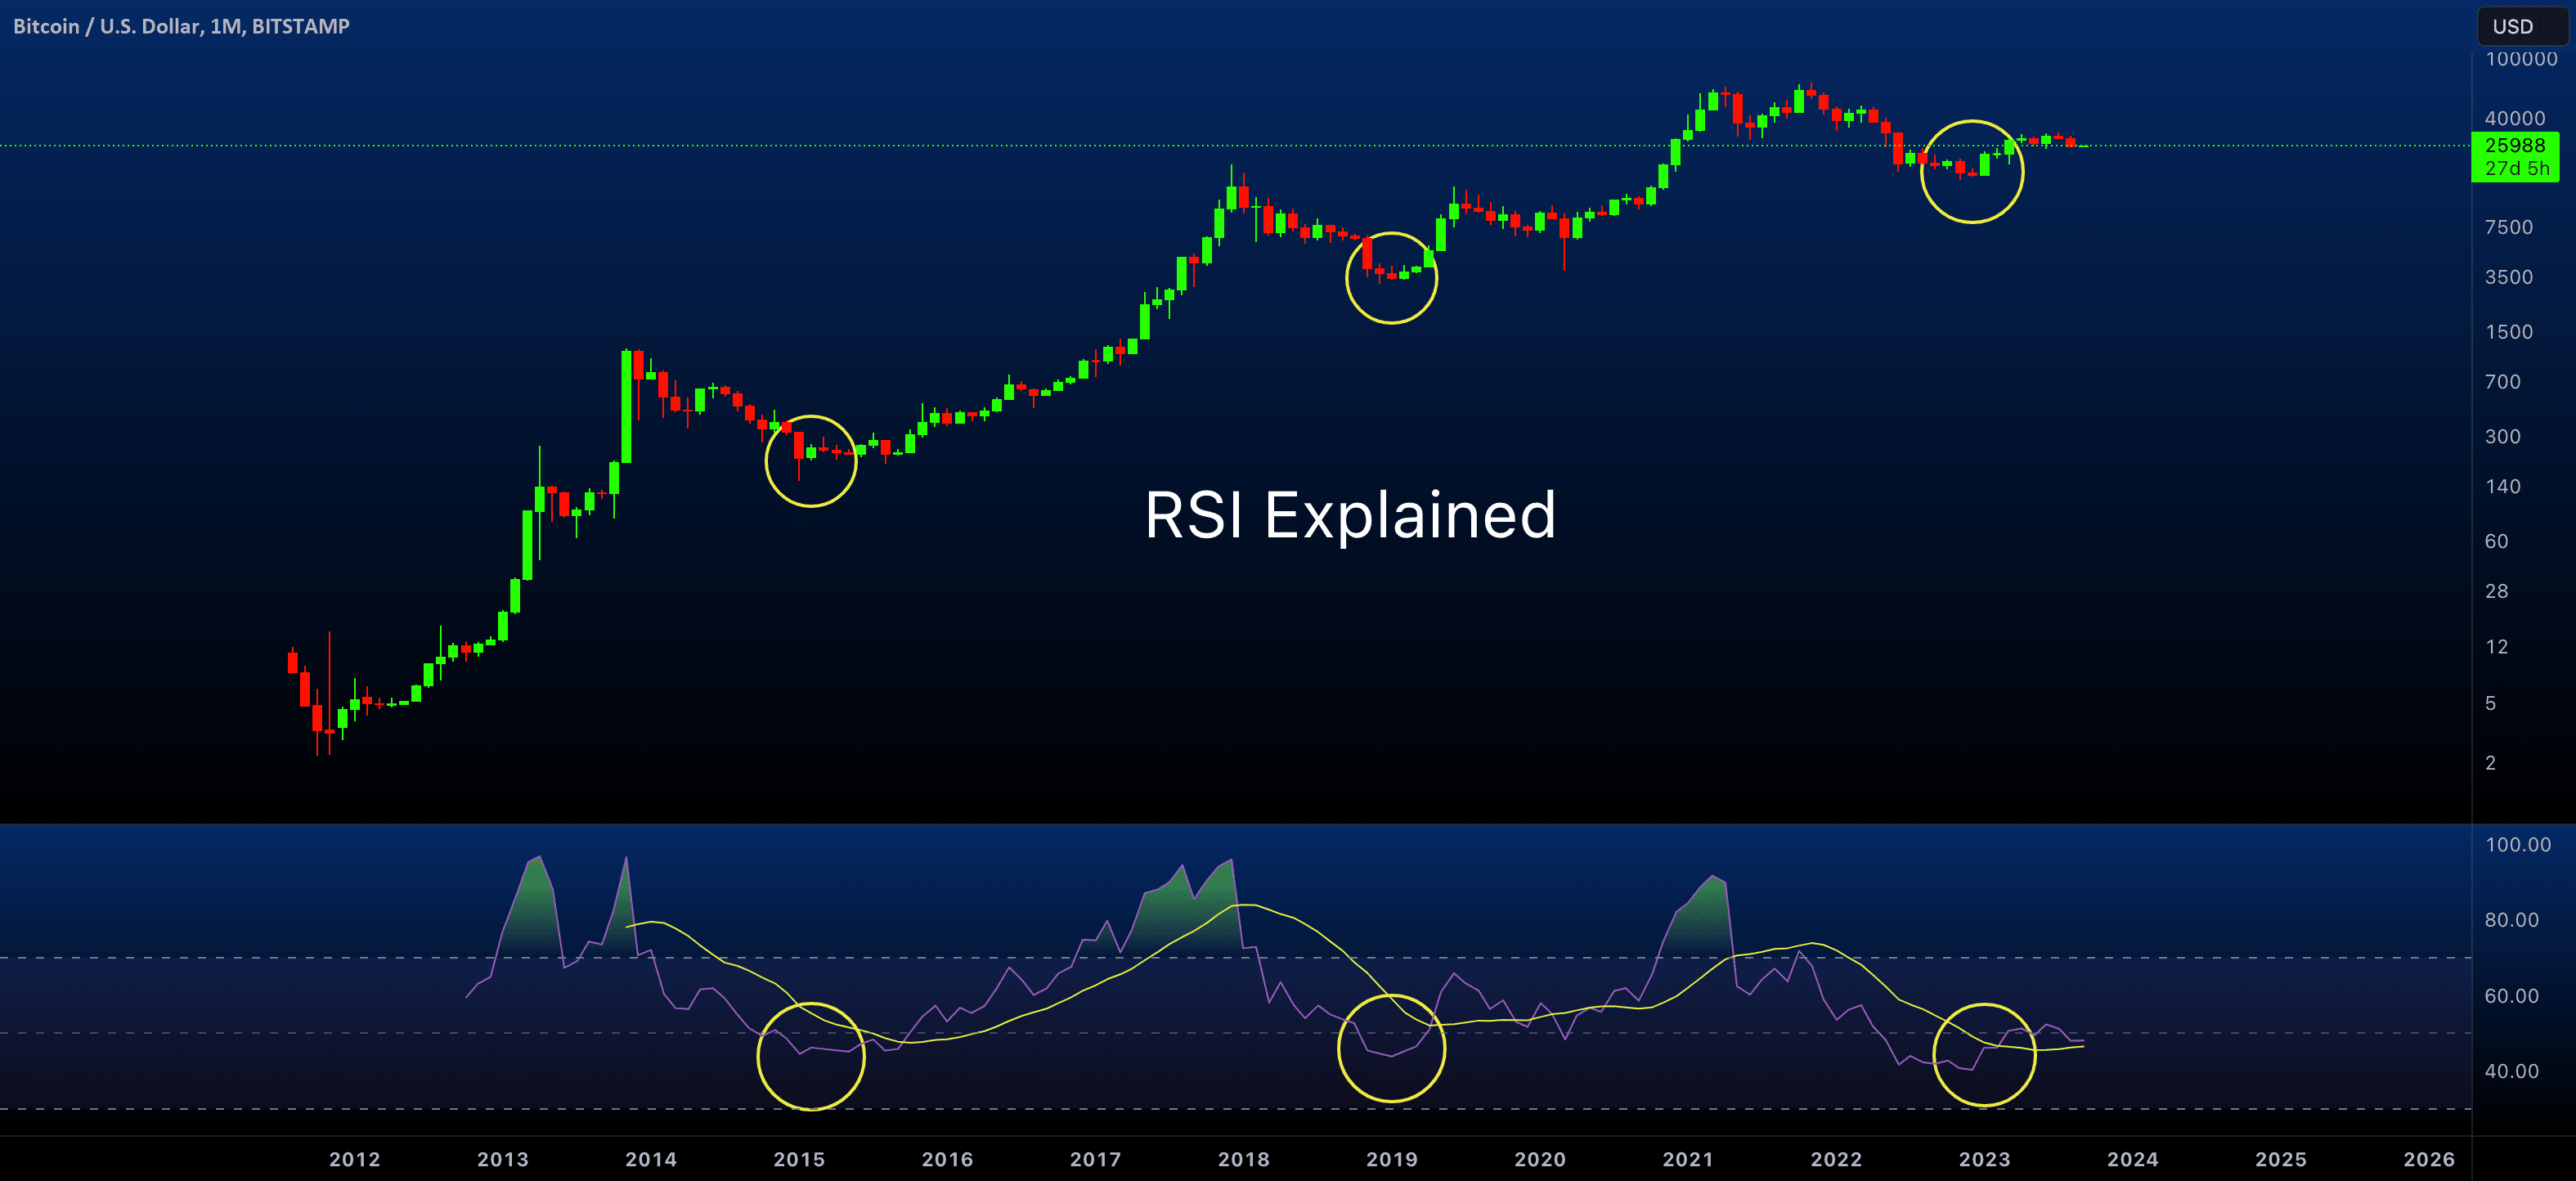
🔥 How does RSI work?
✅ Example: If you see BTC/USD's RSI = 85, you can assume it is currently overbought — it may be time to take profits from the market.
✅ If RSI is 25, it could be a good time to enter a trade.
🔶 What does RSI mean?
🧠 Tips for using RSI:
Do not use RSI alone; it's better to make decisions by using it along with Moving Average or Support/Resistance lines.
RSI divergence can also be a very important signal (when RSI is moving in one direction but the price is moving in the opposite direction).
📈 Trading Strategy with RSI:
✅ RSI + Support Level = Buy Signal
✅ RSI + Resistance Break = Sell Signal
🎯 Often, it is better to make decisions by combining RSI with MACD or EMA rather than looking at RSI alone.
📌 Conclusion
RSI is a very powerful yet simple indicator. If you understand and use it correctly, your trading skills will improve significantly. However, remember that RSI is a supportive tool, not the only means of decision-making.