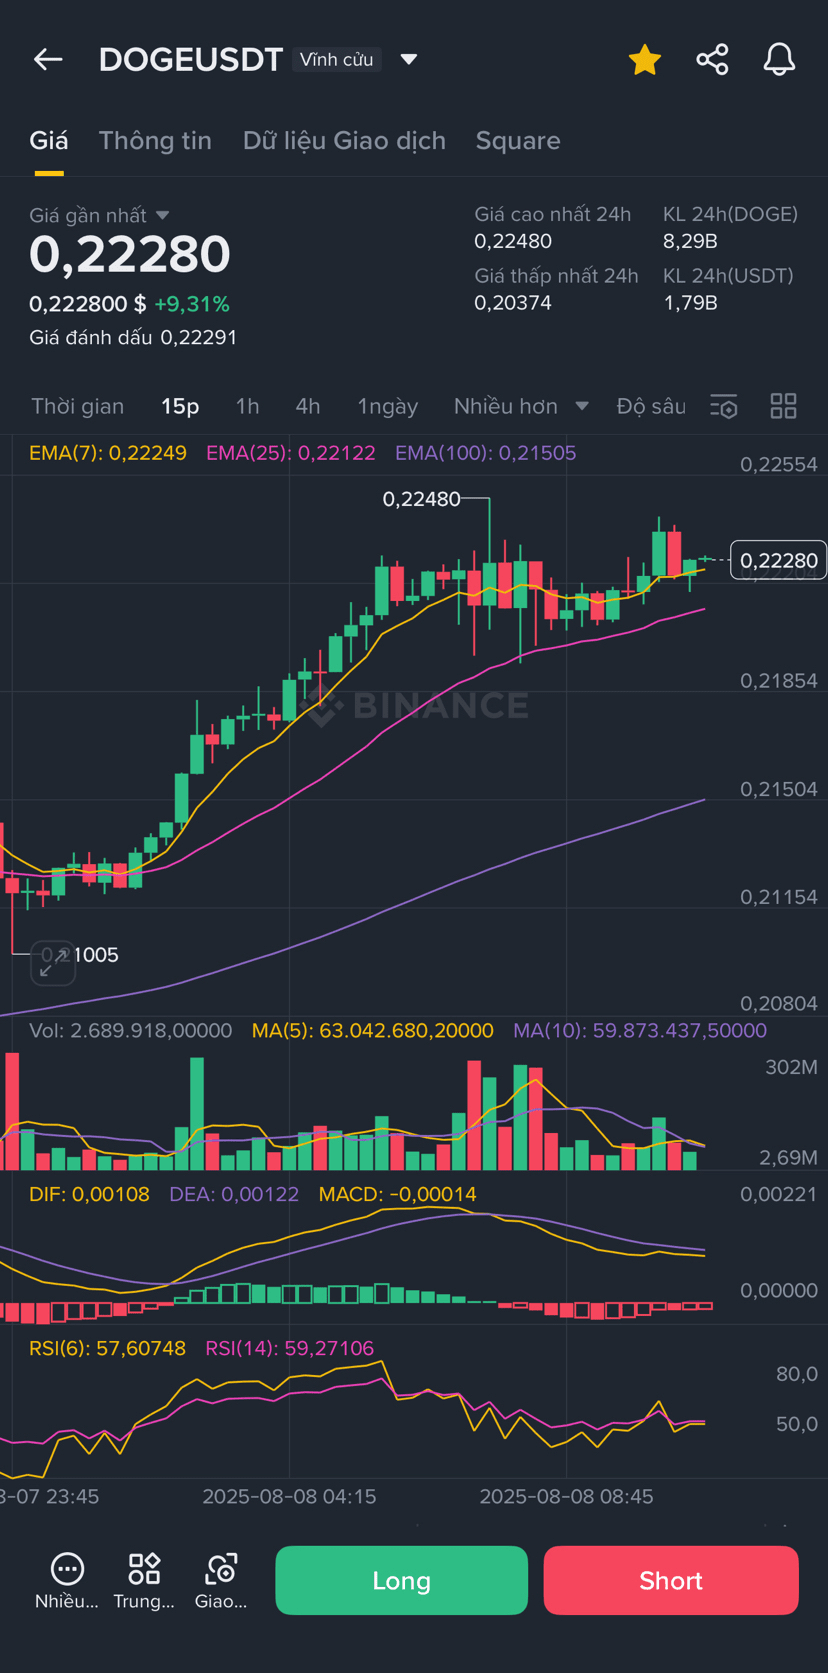
⏰ Update at 10:23 on 08/08/2025
💡 “DOGE just had a spectacular turn, breaking the series of dull days to enter a phase of excitement. But as the market begins to heat up, the question I always ask myself is: Is this the door to a new breakout, or just a FOMO trap being set?”
1️⃣ 4H frame – The overall picture, the trend has changed color
Observing the 4H frame, I clearly see that DOGE has escaped from a series of dull days. From the bottom of ~0.188, the price not only rebounded strongly but also broke through several layers of mid-term EMA, a sign that the market often struggled to achieve in a downtrend.
MACD is giving positive signals: the DIF line has crossed above the DEA, and the green histogram is becoming clearer — this is like the engine being filled with fuel for a longer trip. However, I cannot overlook an important detail: RSI(6) has risen to ~87 and RSI(14) is also at the threshold of 70. This is the overbought zone, and if you have traded for a long time, you will know that when RSI is at this level, the market often tends to take a breather before continuing.
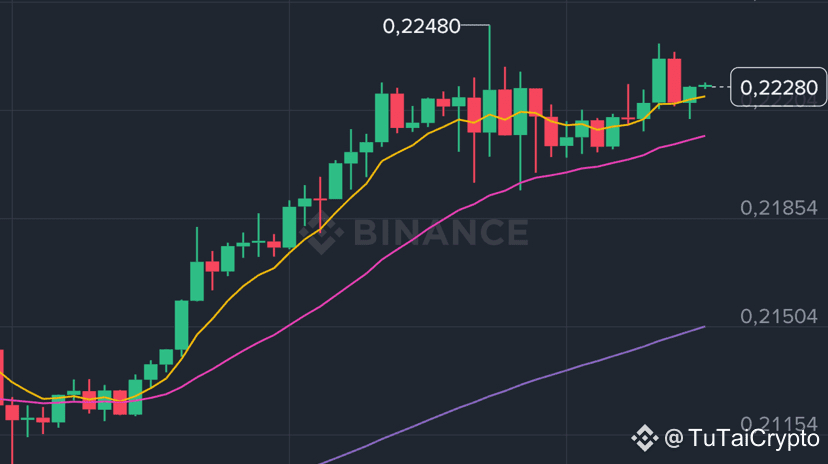
The nearest resistance on the 4H is at the area of 0.2247 — this is the highest peak in the last 24 hours. If decisively surpassed with volume, DOGE could aim straight for 0.2485 (the old peak). Conversely, strong support is around 0.212–0.213 (EMA100) and deeper at the bottom of 0.188.
💬 Personal view 4H: I see that the mid-term trend has tilted entirely towards the buyers, but the excitement is a bit ‘hot’. A slight pullback will help DOGE become stronger for the next journey.
2️⃣ 1H frame – Strong upward momentum, but be cautious of ‘overbought’
On the 1H frame, DOGE is showing outstanding strength. The price is sticking closely to the upper band of Bollinger Bands, EMA25 is far from EMA100 — this is a typical image of a strong upward wave. Volume surged when the price broke out, then gradually decreased as it entered the accumulation phase — a completely normal behavior after a strong run.
MACD still maintains a bullish state with DIF above DEA and positive histogram. But once again, RSI(6) around 82 signals that the market is in the ‘overbought’ zone. This does not mean the price will immediately drop, but it indicates the possibility of a short-term adjustment or sideways movement to absorb the profit-taking pressure.
Short-term support is at EMA25 around 0.215 and EMA100 around 0.207–0.210. These are the areas I often place buy limits when I want to re-enter according to the trend without FOMO at the peak.
💬 Personal view 1H: The buyers are maintaining absolute control, but this is not the ideal time to jump in at all costs. I will wait for either a breakout at 0.2247 with strong volume or a pullback to the support area.
3️⃣ 15m frame – The market is ‘taking breath’
The 15m frame gives us a clear view of the short-term breathing rhythm. After a steep increase, DOGE is currently fluctuating in a narrow range of 0.22–0.224. The short EMAs are still above the long EMA, but the gap has narrowed, signaling that the upward momentum is temporarily slowing down.
MACD on 15m is almost horizontal, small histogram, sometimes slightly red. RSI has also cooled down to levels of 64–69, meaning the market is no longer overbought on the small frame. This gives me the feeling that this is an accumulation phase — where the market ‘compresses the spring’ before choosing the next direction.
💬 Personal view 15m: If trading short (scalp), this is the time to watch closely: breaking 0.224 with volume is a quick long signal, and if the price falls back to EMA25(15m) and bounces back, that is also a short-term buying opportunity.
🎯 Scenarios and strategies
Scenario 1 – Continue to rise (priority)
Maintain above 0.212–0.218 or break 0.2247 with strong volume.
Target: TP1 = 0.2247, TP2 = 0.248.
Scenario 2 – Short-term pullback
Rejected at 0.2247 and weak volume.
Can retreat to 0.205–0.210 to test support; if maintained, the uptrend continues.
Personal strategy:
Swing: Buy 0.215–0.210, SL below 0.205, TP1 0.2247, TP2 0.248.
Breakout: Enter when closing the 1H candle above 0.2247 with volume, SL 0.218.
Scalp: Long when breaking 0.224 (15m) or buy dip EMA25(15m), tight SL.
📝 Summary
DOGE is at an interesting moment: the mid-term trend has just turned bullish, strong momentum, but the overbought indicator warns that the market needs a pause. I prefer to buy when the price pulls back to support or when there is a breakout accompanied by volume, rather than FOMO at the peak.
📌 What do you think? Will DOGE take a breather and then break through, or will it adjust deeply? Share your perspective!
👉 I mainly trade on Binance – newcomers can use the link below to reduce trading fees permanently (and support me a bit): thank you all very much.
Invite code: GRO_20338_SMYIM
👉 https://www.binance.com/referral/earn-together/refer-in-hotsummer/claim?hl=vi&ref=GRO_20338_SMYIM