Basic knowledge of candlestick charts: 24 types of candlestick chart explanations, classic and worth collecting!
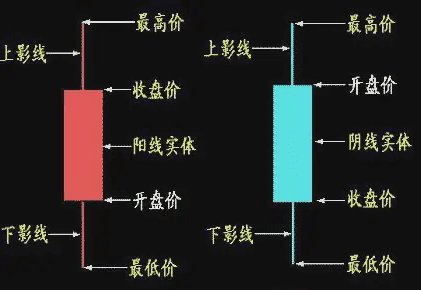
Candlestick charts, also known as candlestick charts, are said to have originated in the 18th century in Japan's rice market, where rice merchants used them to represent price fluctuations. Due to their unique drawing method, they have been widely adopted in stock and futures markets. They are drawn based on the opening price, highest price, lowest price, and closing price of each trading day (or each analysis period), and the structure of the candlestick can be divided into three parts: upper shadow, lower shadow, and middle body.
A candlestick is a columnar line composed of shadows and bodies. The rectangle in the middle is called the body, the thin line above the body is called the upper shadow, and the part below is called the lower shadow. Bodies are divided into bullish and bearish candles.
Candlesticks can be divided into daily, weekly, and monthly candlesticks. In dynamic stock analysis software, minute and hourly candlesticks are also commonly used. Candlesticks are a special language of the market, with different forms conveying different meanings.
Candlestick charts have the characteristics of being intuitive, three-dimensional, and carrying a large amount of information. They encompass rich Eastern philosophical thoughts, fully displaying the strength of price trends, changes in the balance of power between buyers and sellers, and accurately predicting future market directions. They are widely used in various media and computer real-time analysis systems as a technical analysis method.
Candlesticks graphically represent the changes and transformations of buyers and sellers' forces and practical results. After nearly a century of use and improvement, candlestick theory has been widely accepted by investors.
24 types of candlestick chart explanations, classic and worth collecting
What is technical analysis used for, if not to predict trends? This is the thought of many people. Take a look at this example:
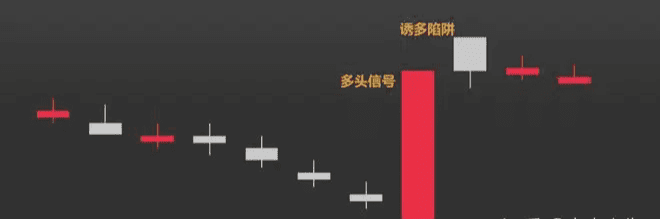
A large bullish candle releases a strong bullish signal. If one buys based on the bullish signal released by the candlestick, thinking that the market will rise, one can easily fall into a trap of being lured by the market. The true meaning of technical analysis is to discover the facts of the market. Professional traders will develop corresponding strategies based on the market facts rather than using them to predict future trends. Before learning about candlesticks, it is crucial to remember these three points:
Bullish signals do not equal a bullish outlook for the future;
A bullish outlook does not equal a suitable buying point;
A suitable buying point does not equal stable profit.
Characteristics and basic drawing methods of candlestick charts
The popularity of candlestick charts is due to their simplicity, intuitiveness, completeness, and thorough reflection of market information.
Compared to the most original trading information, such as delivery slips and intraday charts, it is more intuitive.
Compared to its predecessors, such as line charts and anchor charts, it is more concise.
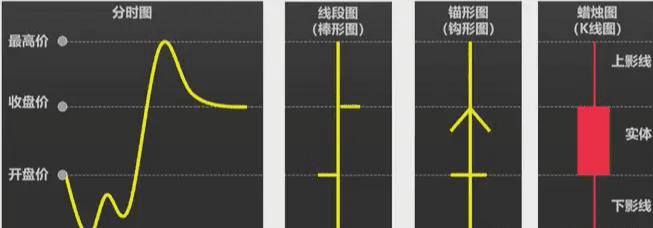
Compared to indicators like moving averages, MACD, and Bollinger Bands, it is more complete. Most indicators only calculate the closing price and perform various statistical analyses on these prices, losing original information. In contrast, candlestick charts faithfully and completely record the opening price, closing price, highest price, and lowest price.
Types of single candlesticks and judgment methods
The types of single candlesticks can be arranged and combined according to color, body size, and the length of upper and lower shadows, resulting in over 30 different types of candlesticks.
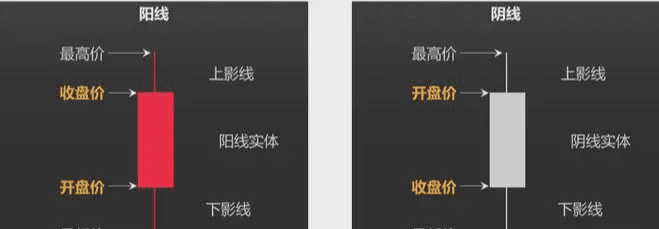
1. Look at the color of the candlestick: divided into bullish and bearish;
2. Look at the body size: divided into four types
A body range of less than 1% is generally referred to as a doji;
A body range of 1-3% is generally referred to as a small bearish or bullish candle;
A body range of 3-7% is generally referred to as a medium bearish or bullish candle;
A body range greater than 7% is generally referred to as a large bearish or bullish candle.
3. Look at the length of the shadows
No upper shadow: a full head, such as a full-head bullish candle;
No lower shadow: a full foot, such as a full-foot bullish candle;
If the shadow length is more than twice the body, it is specifically noted, such as a bullish candle with a long upper shadow.
You only need to know these 30+ types of candlesticks; there is no need to memorize them. In practical situations, you will become proficient through experience. It is important to remember the three steps for judging a single candlestick:
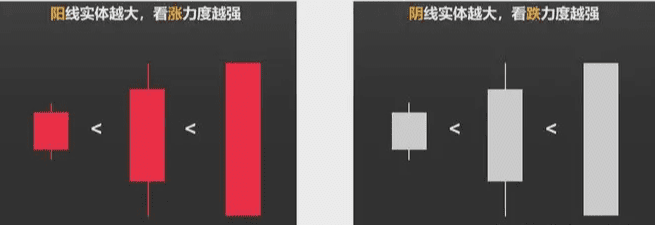
First, look at the candlestick color. A bearish candle reveals the fact of a decline, while a bullish candle reveals the fact of an increase;
The second point is to look at the size of the candlestick body, as the body size reveals the intensity of price movements. If the body is too small, the significance of the color (bearish or bullish) is diminished.
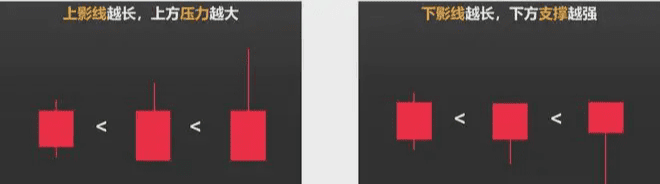
The third point is to look at the length of the candlestick's shadows. The length of the shadows indicates the strength of resistance and support.
Doji
The opening and closing prices of a doji are almost equal, with a very small body. Depending on the different positions of the upper and lower shadows, they can be classified into long-legged dojis, gravestone dojis, dragonfly dojis, etc.
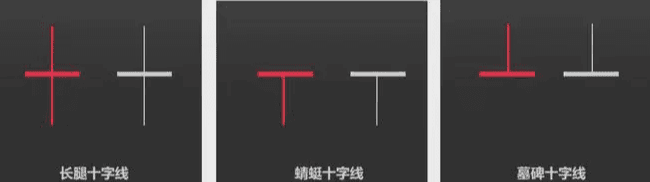
Doji reveals the balance of power between bulls and bears. Generally speaking, a trend change is likely to occur after a doji, altering the previous trend direction.
If a doji appears during an upward trend, it reveals the fact that the upward momentum is weakening; if a doji appears during a downward trend, it reveals the fact that the downward momentum is weakening;
If a doji appears in a sideways trend, or if multiple dojis appear near the same price, then the doji cannot provide a signal for trend change.
The same candlestick shape appearing in different positions reveals different facts. The key here is the trend.
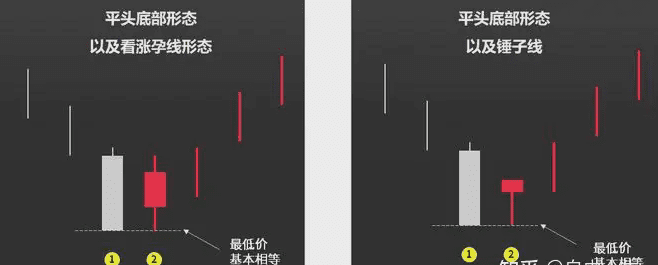
Hammer line, inverted hammer line, hanging man, shooting star
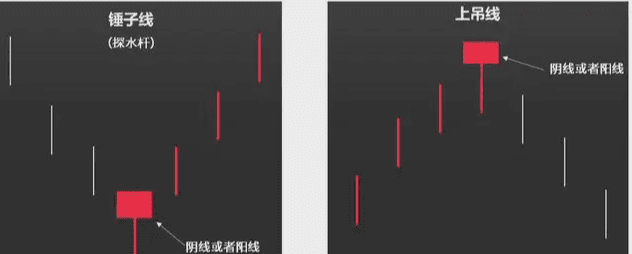
The hammer line and hanging man line look very similar in form:
The body is very short, and the lower shadow is very long, generally more than twice the body;
No upper shadow, or the upper shadow is very short;
It can be either a bearish or bullish candle, with the body color being of little significance;
It appears in a clear downtrend and is called the 'hammer line', meaning 'solidifying the market bottom', signaling the end of the downtrend;
It appears in a clear uptrend and is called the 'hanging man', which is an ominous name, signaling the end of the uptrend.
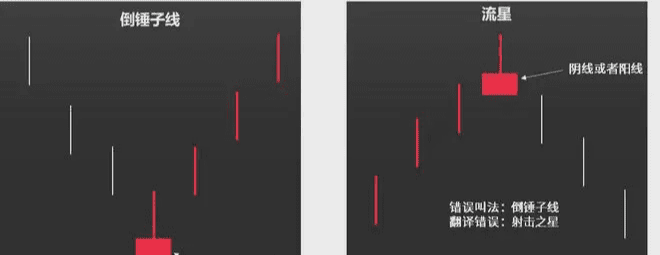
Flipping the hammer candlestick shape upside down gives the inverted hammer. Like the hammer candlestick, it signals the end of a downtrend.
Flipping the hanging man shape upside down gives the shooting star. Like the hanging man, it signals the end of an uptrend.
Some people refer to the shooting star as the 'inverted hammer', while others call it the 'shooting star'.
The former was absurdly wrong. Hammer and inverted hammer candlesticks must appear in a downtrend, indicating a solidification of the market bottom. The shooting star appears in an uptrend, meaning 'trouble from the sky'. The position of the candlestick reveals different market meanings.
The latter is a translation error. The Japanese term for shooting star translates to English as 'shooting star' and then to Chinese as '射击之星', losing the original downward implication of the name.
Bullish engulfing pattern, bearish engulfing pattern
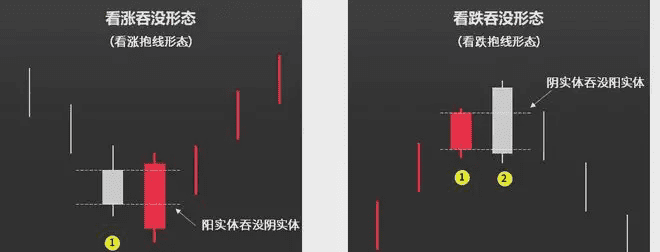
The engulfing pattern, also known as the hugging line pattern, is a major trend reversal signal, revealing that the market has ended its previous direction of movement and is moving in the opposite direction. There are three criteria for identification:
The market is in a clear uptrend or downtrend;
The engulfing pattern consists of two candlesticks, where the body of the second candlestick must cover the body of the first candlestick;
The two candlesticks have opposite colors. In a bullish engulfing pattern, the first is a bearish candle and the second is a bullish candle. In a bearish engulfing pattern, the first is a bullish candle and the second is a bearish candle. Exception: If the body of the first candlestick is very small, it can be either a bearish or bullish candle.
Bullish engulfing, bearish engulfing, and engulfing patterns look very similar but are actually different.
The engulfing pattern must appear in a clear uptrend or downtrend. However, bullish engulfing and bearish engulfing can appear in any trend.
Since trends are considered in the definition of patterns, the engulfing pattern has more practical significance for trend identification.
Pregnant line pattern
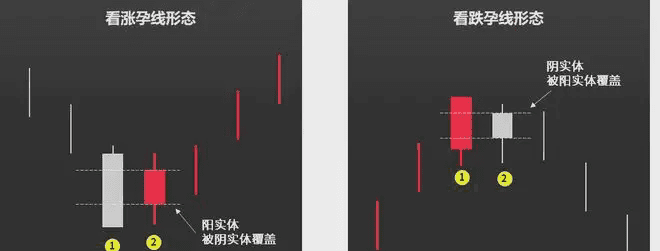
The pregnant line pattern is a secondary trend reversal pattern, indicating that the intensity of the trend reversal is weaker than that of the engulfing pattern. It also consists of two candlesticks, which visually switch the positions of the two candlesticks in the engulfing pattern. There are three criteria for identification:
The market is in a clear uptrend or downtrend;
The pregnant line pattern consists of two candlesticks, where the body of the first candlestick must cover the body of the second candlestick;
The two candlesticks have opposite colors. In a bullish pregnant line pattern, the first is a bearish candle, and the second is a bullish candle. In a bearish pregnant line pattern, the first is a bullish candle, and the second is a bearish candle. Exception: If the body of the second candlestick is very small, either a bearish or bullish candle is acceptable.
If the second candlestick is a doji, it is habitually called a doji pregnant line.
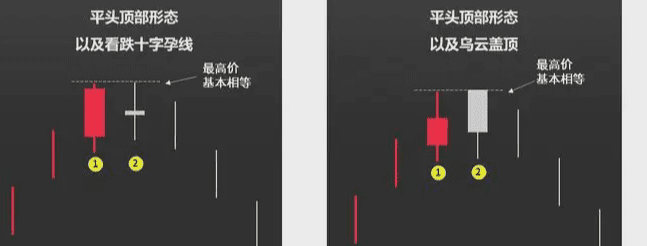
Dark cloud cover and piercing pattern
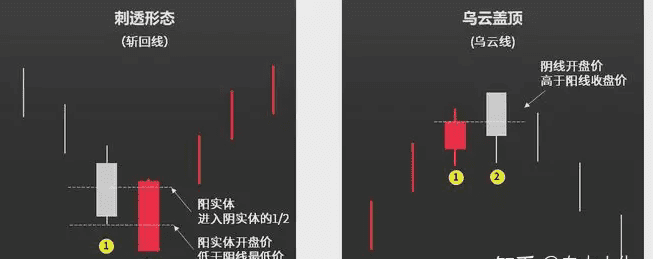
Dark cloud cover, also known as dark cloud line, belongs to the top trend reversal pattern. It reveals the fact that the rise has ended and the decline has begun. There are three criteria for identification:
The market is in a clear uptrend;
Consisting of two candlesticks, the first is a relatively large bullish candle, and the second is a relatively large bearish candle;
The opening price of the bearish candle is higher than the closing price of the first candlestick, meaning it exceeds the body of the first candlestick.
The piercing pattern, also known as the piercing line, is similar to flipping the clouds over, belonging to a bottom trend reversal pattern. Criteria for identification:
The market is in a clear downtrend;
Consisting of two candlesticks, the first is a relatively large bearish candle, and the second is a relatively large bullish candle;
The opening price of the bullish candle is lower than the lowest price of the first candlestick, meaning it is below the bottom of the lower shadow of the first candlestick;
The more the bullish candle's body penetrates the bearish candle, the stronger the bullish momentum. Ideally, the closing price of the bullish candle should be above half of the bearish candle's body.
Counterattack line
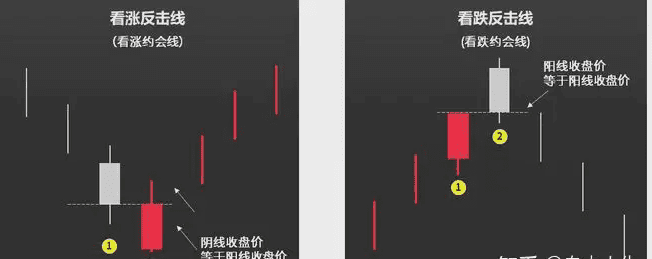
When two candlesticks of opposite colors have equal closing prices, they form a counterattack line, also called a rendezvous line.
Criteria for identifying bullish counterattack line:
The market is in a clear downtrend;
Two candlesticks consist of the first being a bearish candle and the second being a bullish candle, with equal closing prices;
The larger the body of the second candlestick, the stronger the bullish momentum.
Criteria for identifying bearish counterattack line:
The market is in a clear uptrend;
Two candlesticks consist of the first being a bullish candle and the second being a bearish candle, with equal closing prices;
The larger the body of the second candlestick, the stronger the bearish momentum.
Belt hold line
The name of the belt hold line comes from a term used in Japanese sumo wrestling, meaning "to grab the opponent's belt and push him out of the ring." The belt hold line is divided into bullish and bearish belt hold lines.
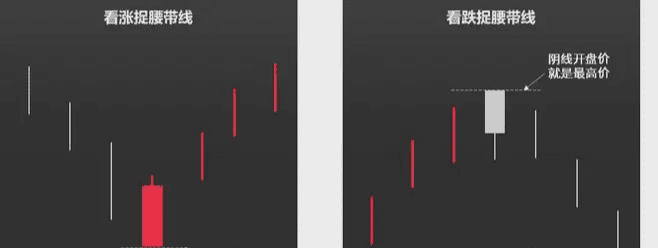
Criteria for identifying bullish belt hold line:
The market is in a clear downtrend;
Consisting of one large bullish candle;
The opening price is the lowest price, with no lower shadow, or a very short lower shadow.
Criteria for identifying bearish belt hold line:
The market is in a clear uptrend;
Consisting of one large bearish candle;
The opening price is the highest price, with no upper shadow, or a very short upper shadow.
Morning star and evening star
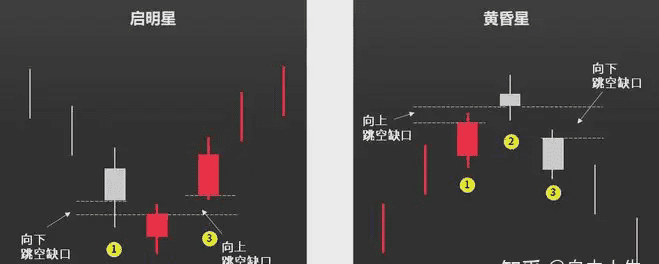
The morning star and evening star consist of three candlesticks forming a trend reversal pattern. As the name suggests, the morning star signals a trend reversal from bearish to bullish, while the evening star signals a trend reversal from bullish to bearish.
Criteria for identifying morning star:
Appearing in a clear downtrend, consisting of three candlesticks;
The first is a bearish candle, and the third is a bullish candle;
The middle candlestick body is relatively small and can be either bearish or bullish. If the middle candlestick is a doji, it is habitually referred to as a doji morning star;
A standard morning star has two gaps.
In practice, the second gap is not common. The larger the body of the third candlestick and the larger the volume, the greater the bullish momentum. If the second candlestick is a doji, it is generally referred to as a doji morning star.
Criteria for identifying the evening star:
Appearing in a clear uptrend, consisting of three candlesticks;
The first is a bullish candle, and the third is a bearish candle;
The middle candlestick body is relatively small and can be either bearish or bullish. If the middle candlestick is a doji, it is habitually referred to as a doji evening star;
A standard evening star has two gaps.
The evening star and morning star patterns contain a very practical thought process. The three candlestick patterns represent the confirmation of the current trend, the warning of trend change, and the confirmation of trend change, respectively. This thought process is more significant than the practical guidance of the pattern itself and is worth reflecting on and practicing.
Three crows
Three crows are also called three-winged crows or three-flying crows. 'Good things do not leave the door, bad things have wings.' Three crows are a bearish trend reversal signal.
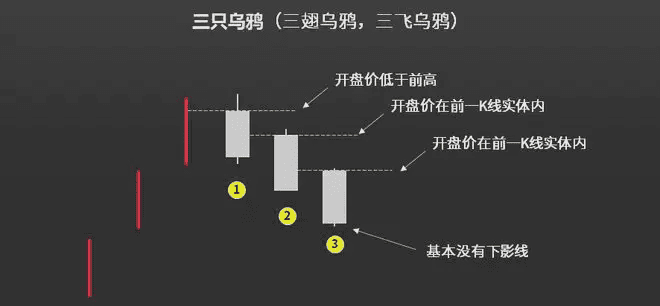
Criteria for identifying the three crows pattern:
Appearing in a clear uptrend;
Consisting of three consecutive, relatively large bearish candles;
No lower shadow, or a very short lower shadow;
The standard three crows have each bearish candle's opening price within the body of the previous candlestick (no gaps).
Three crows are generally used for medium to long-term trend analysis and are rarely used for short-term analysis.
Flat top pattern and flat bottom pattern
In an uptrend, two candlesticks with nearly equal highest points form a flat top pattern, signaling a reduction in upward momentum. Generally, the flat top pattern will also appear in conjunction with other patterns. For example:
In a downtrend, two candlesticks with nearly equal lowest points form a flat bottom pattern, signaling a reduction in downward momentum. The flat bottom pattern may also appear in conjunction with other patterns. For example:
The above are commonly used candlestick patterns, suitable for beginners to learn and for experienced traders to review repeatedly. Beginners look at price, experienced traders look at shapes, and masters understand the essence. These classics, even after many years of practical experience, can still yield new insights upon revisiting.
Seven stock trading insights:
1. Go with the trend.
This is a simple and essential principle: the most important point in stock trading is to not go against the trend. Operating against the trend will only wear down your mindset. Operating with the trend will only make your mindset increasingly calm, and the success rate will be higher. This is mainly reflected in the moving averages showing a bullish arrangement, with the stock price above the 60-day moving average, indicating a clear upward trend.
2. Continuously improve through learning.
From the moment one steps into the stock market, no one can stop learning and must constantly update their knowledge and understanding. Various financial news, company reports, and various research reports are all ways for us to obtain information. Observing how individual stocks react to specific information helps to train one's sensitivity, allowing one to remain calm in changing situations.
3. Choosing is more important than effort.
Striving in the wrong direction will only be futile; running on the right track can yield twice the result with half the effort. Choose stocks with high performance, low valuation, and a circulating market value of less than 200 million; such companies are more likely to attract capital and have high growth potential.
4. Learn to read simple technical indicators.
Trading volume is the first important indicator to look at. If a stock breaks out at a low point but does not increase volume, it indicates that the volume indicator is weak, so don't be blinded by the outward appearance of the stock price. If there is a decrease in volume while rising at a high point, it indicates sufficient upward momentum and potential for further increases. The second point is to look at the chip distribution; avoid stocks with dispersed chips. This means the main force has not accumulated enough, and it will likely continue to oscillate. However, if the chips are relatively concentrated and there is a significant increase in volume one day, it means the main force is starting to push the price up.

5. Take control of your fate in the stock market.
Many friends lack independent judgment and prefer to adopt others' suggestions. This is highly undesirable, as everyone's judgment of the market is different. If you ask a hundred people, you may get a hundred opinions, which will only confuse your own judgment and make it difficult to decide. You should have your own trading system, listen to your own voice, hold onto your stocks if you are right, and strictly cut losses if you are wrong.
6. Have the courage to hold onto profitable stocks.
If a stock is in a currently popular market theme and retraces during its rise, do not rush to exit. Especially for stocks that have had consecutive limit-ups, as long as the retracement does not exceed 20%, it is worth observing further. It is hard to catch a dragon turning back.
7. Do not easily touch stocks that have not emerged from the bottom.
Until you have emerged from the bottom, any predictions you make are merely wishful thinking. Many friends also determine the bottom by daily line breakthroughs, but daily lines are often where the main force's tricks lie; false breakthroughs are the norm. A very simple method is to use the weekly line to measure the bottom; long-term breakthroughs are the most authentic. Usually, look at the 90-week moving average; do not consider anything below it.
Today's sharing ends here. If you find it helpful, remember to like and save it for easy reference later. The above is the essence of my 18 years of stock trading experience, shared with everyone, hoping to be of help.
#币安Alpha上新 #国产概念币集体爆发 $BTC

