
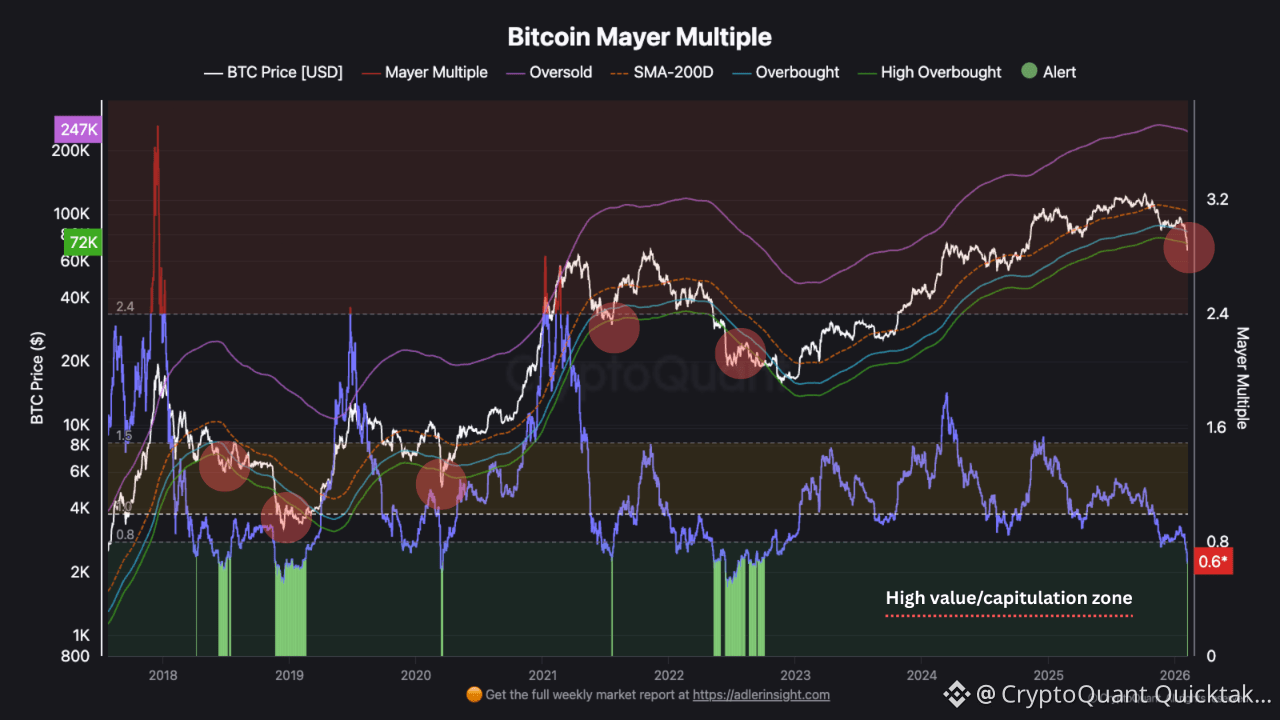
The Mayer Multiple just dropped to 0.6 — meaning Bitcoin is trading at 60% of its 200-day moving average. This level of statistical deviation from trend has only occurred during severe capitulation phases.
📊 What This Measures
The Mayer Multiple is deceptively simple: current price divided by 200-day moving average. But what it captures is powerful — the degree to which price has deviated from its long-term trend.
A reading of 1.0 means price equals the 200-day MA. Above 1.0 means premium to trend. Below 1.0 means discount.
Key thresholds:
Above 2.4: Historically overbought (bubble territory)
1.0-1.5: Normal bull market range
0.8-1.0: Discount to trend (accumulation zone)
Below 0.8: Statistically oversold (capitulation)
Current reading: 0.6 — price is 40% below its long-term trend. This isn't a small dip. This is statistical extreme.
🔍 Historical Precedent
Mayer Multiple below 0.7 has occurred only during major capitulation events:
→ Dec 2018 (0.5-0.6): Bear market bottom at $3,200. 12-month outcome: +340%
→ Mar 2020 (0.5): COVID crash. 12-month outcome: +1,100%
→ Nov 2022 (0.5-0.6): FTX collapse bottom. 12-month outcome: +170%
→ Now (0.6): Current reading
Every prior instance of Mayer Multiple this low marked a clear capitulation.
📈 Why This Matters
When price deviates 40% below its 200-day average, the market is pricing in worst-case scenarios that historically don't materialize for extended periods.
The Mayer Multiple doesn't predict exact bottoms. It identifies statistical extremes where risk/reward shifts meaningfully.
⏳ What This Doesn't Guarantee
→ Precise timing (bottoms can take 2-8 weeks to form)
→ No further downside (can easily overshoot to 0.5 in panic)
→ Immediate reversal (consolidation often follows)
Current setup: 40% discount to trend, matching only the most severe historical capitulation phases.
Written by RugaResearch