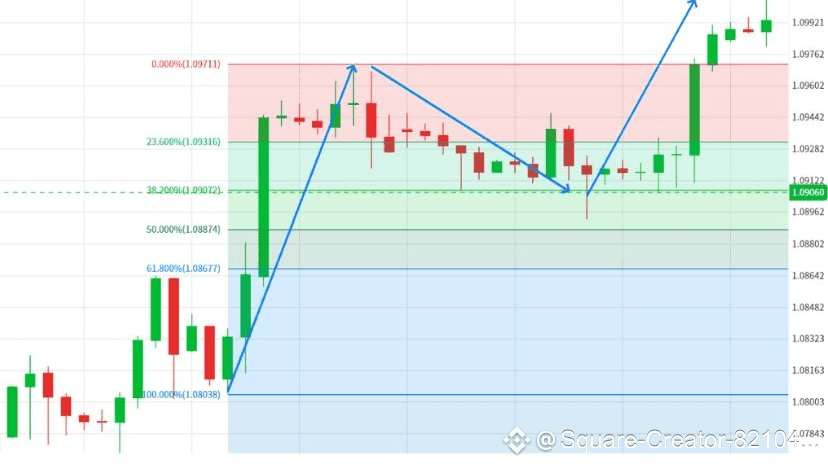
The Fibonacci tool is one of the most popular tools among traders, as it helps in identifying retracement levels during both upward and downward trends.
The idea is simple: the price does not move in a straight line, but rather corrects and returns, with levels like 38.2% – 50% – 61.8% considered potential reversal areas.
💡 General trading tip:
Use Fibonacci levels as a supplementary tool only, and combine them with other confirmation signals such as reversal candles or momentum indicators (RSI – MACD).
📍 🔑 Key Takeaways:
Fibonacci helps to identify correction or reversal areas.
The most commonly used levels: 38.2%, 50%, 61.8%.
It can be applied in both directions (upward and downward).
Do not rely on it alone, but combine it with other indicators.
✅ Practical Checklist:
Choose a clear direction (upward or downward).
Identify the main bottom and top.
Draw the Fibonacci tool from the bottom to the top (or vice versa).
Monitor price behavior at levels 38.2%, 50%, 61.8%.
Look for confirmation signals before entering.