
The wallets holding more than 100,000 SOL increased their share from 57.81% to 58.95% since August 19.
The smart money index rose from 261.62 on September 7 to 290.14 on September 12, adding to the bullish outlook.
Solana is trading within an upward channel, with $244 as the next target if the breakout is confirmed.
Solana is trading around $239 at the time of publication on September 12, up more than 4% in the past 24 hours. Weekly gains stand at about 15%, while the past month shows an increase of 18%. Over the past three months, the price of Solana has risen over 55%.
In recent weeks, the rallies have often faced selling pressure as profit-takers quickly locked in gains. While this risk still exists, two strong market groups now add support. Their actions together suggest that the bullish structure is gaining strength.
Whales are accumulating, and exchange flows confirm strength
The relative supply distribution metric for addresses, which tracks the amount of supply held in wallets of varying sizes, indicates that holders with more than 100,000 SOL (whales and sharks) have resumed accumulation. Since August 19, their holdings have increased from 57.81% to 58.95% of the total circulating supply.
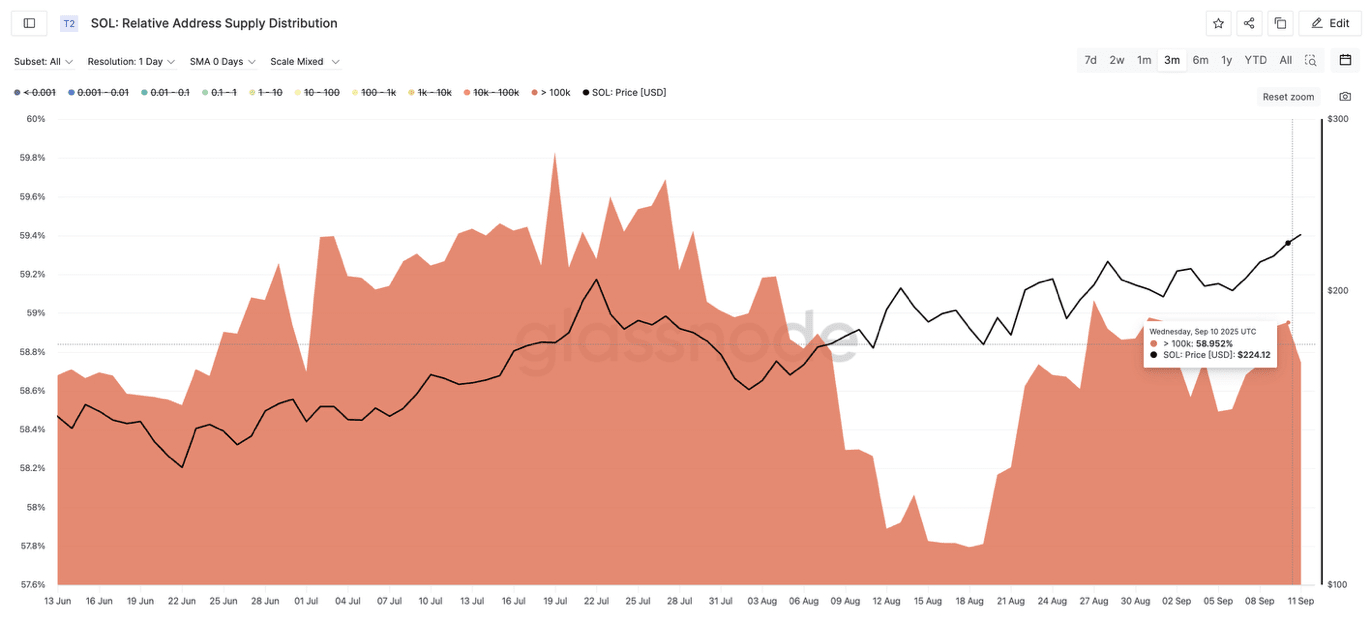
Solana whales have started adding to their holdings: Glassnode
History shows why this is important. On July 1, when $SOL was trading near $146, these whales held 58.69%. They increased this position to 59.83% as Solana rose to $205 — an increase of nearly 40%. Their decision to add again while Solana trades above $230 suggests they expect further upside.
This activity is also reflected in the net position change metric on exchanges. On September 10, while Solana was rising, around 291,000 SOL flowed into exchanges. Typically, these inflows indicate profit-taking. However, just one day later, when Solana surpassed $227 (a key level on the price chart later), the balance sharply turned negative, indicating external outflows of 1.77 million SOL.
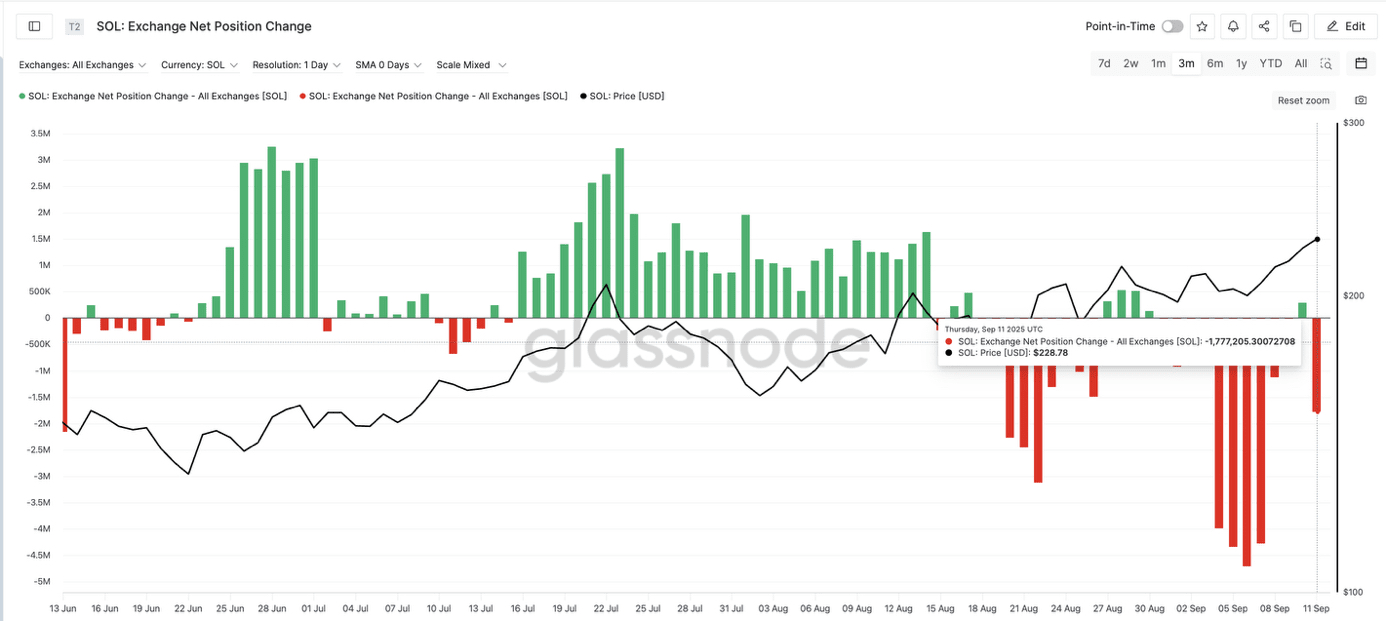
Solana price and return of buying pressure: Glassnode
This is considered unusual compared to recent weeks, where traders were quickly selling the rallies. The shift indicates that holders are moving tokens away from exchanges, reducing immediate selling pressure. Although the three-month average for both metrics has not yet reached previous peaks, the trend is approaching; another signal that momentum may be building.
Smart money bets on the breakout while forming key Solana price levels
Alongside the whales, the smart money index, which tracks activity from high-conviction addresses, rose from 261.62 on September 7 to 290.14 today. These wallets often buy on strength and sell quickly at highs. Their increased activity suggests bets on continued price increases.
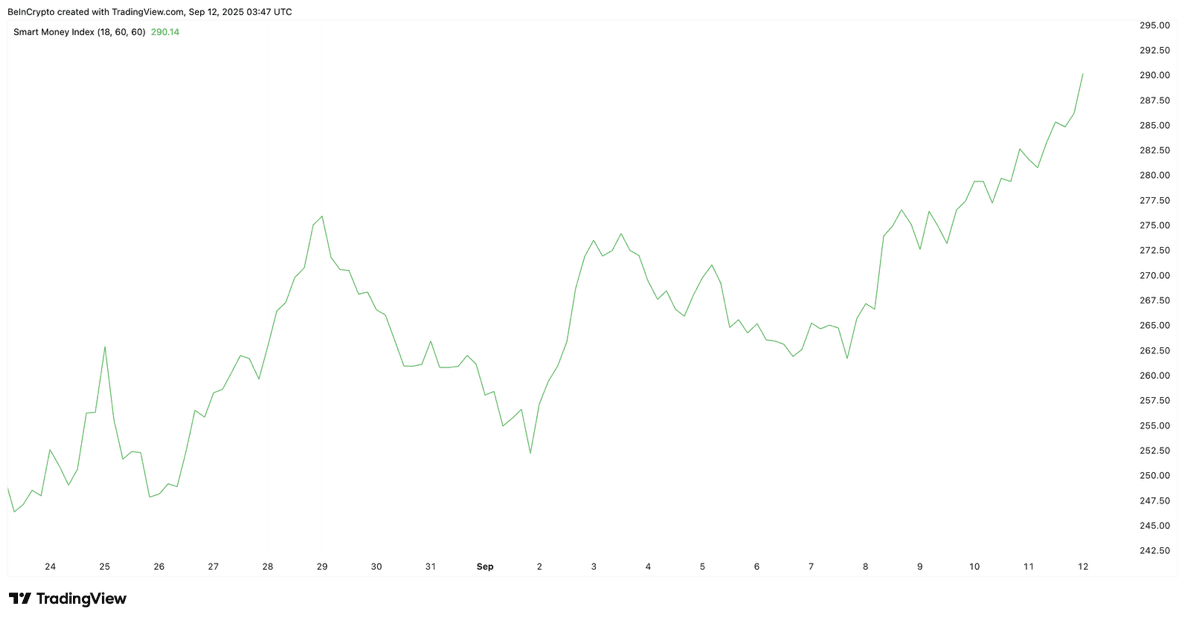
Large smart money bets on SOL price: TradingView
In the 4-hour price chart for $SOL , SOL is trading within a rising channel pattern, which often breaks upward. The next test lies at the upper trend line. A clean 4-hour candle close above the upper trend line will confirm the breakout. If this happens, the measured move indicates $244 as the next target for Solana's price.
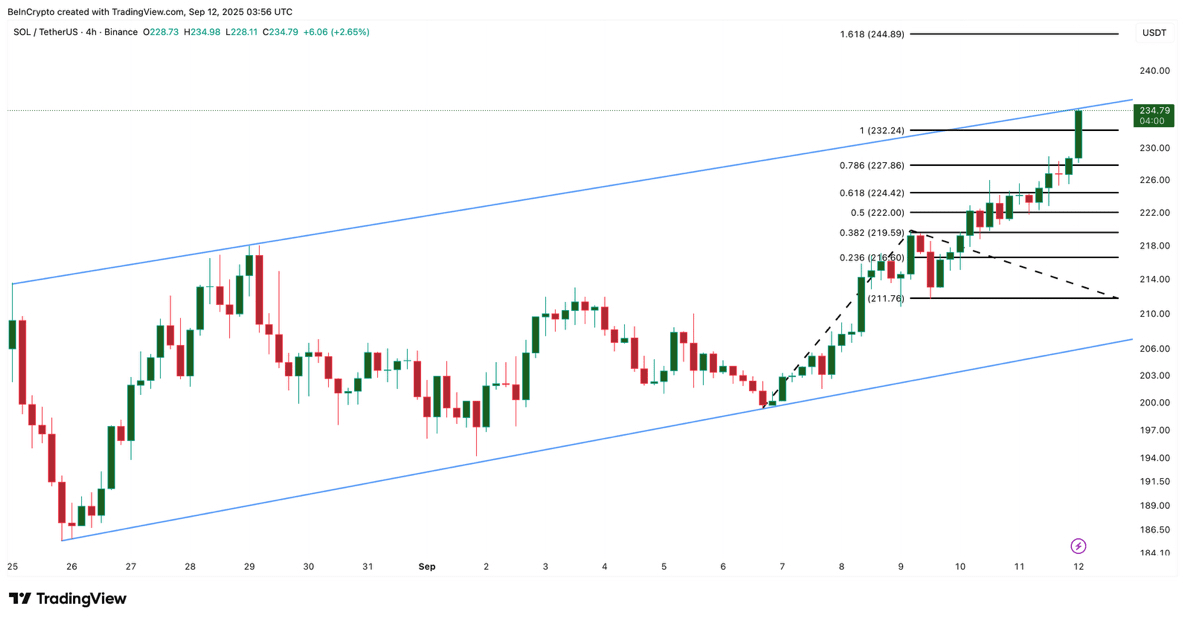
Solana price analysis: TradingView
Support remains staggered below. Strong demand areas are at $227 and $224, with deeper support at $211 in the near term. A drop below this level would weaken the current bullish structure.
But for now, the setup for $SOL price looks positive, with both the whales and smart money aligned on the bullish side. However, confirmation of the breakout is still needed.
#solana #BinanceSolana #BinanceSquare #BinanceSquareFamily #Write2Earn