The success rate of wedge reversal trades is not a fixed value, but fluctuates between 40% and 82% depending on the type of wedge, market context, and trading strategy.
Key statistical data
Statistical dimension success rate/probability description for descending wedge bullish exit is about 82%. The probability of ascending after a descending wedge breakout is about 75%. The probability of ascending after a descending channel/bull flag breakout is about 75%. The probability of descending after a wedge top breakdown is about 75%. The probability of descending after an ascending channel/bear flag breakdown is about 75%. The probability of reaching the target price for the descending wedge is between 63% and 88%. The probability of achieving theoretical measurement targets after a breakout is about 40%. The success rate for major reversal trades is about 40%, indicating the probability of successfully exiting the reverse wave after entering at the first reversal signal. The false breakout rate is between 10% and 27%, indicating the probability of quickly retracing and failing after a pattern breakout.
Why is there such a large discrepancy in the data?
These discrepancies mainly stem from differences in statistical caliber and trading strategies:
High success rate (75%–82%): Typically refers to the statistical probability of the pattern itself breaking in the indicated direction, that is, the likelihood that the market moves in the direction predicted by the wedge.
Low success rate (about 40%): Generally refers to the trading success rate when entering immediately upon the appearance of the first reversal signal, as the market often requires a second confirmation to form an effective reversal.
Moderate success rate (about 50%): Refers to the success rate of the first breakout at the top/bottom of the wedge; about half of the breakouts will fail and pull back.
How to improve trading success rate?
Wait for the second entry point: When the channel is tight, the first reversal attempt (first entry) often fails; waiting for the market to show a lower high (downward reversal) or a higher low (upward reversal) before entering significantly increases the success rate.
Combine volume confirmation: A significant increase in volume during a breakout can enhance the reliability of the signal; low-volume breakouts carry a high risk of false signals.
Ensure the pattern is complete: At least two highs and two lows (a total of 5 legs) are needed to form an effective wedge; the closer the pattern is to textbook standards, the higher the reversal probability.
Pay attention to market context: The probability of reversal is higher when the wedge appears at the end of a long-term trend; if it appears midway through a trend, it may just be a continuation pattern, and one should trade in the direction of the trend.
Adopt a 'pullback entry' strategy: After a breakout, wait for the price to pull back to the broken trend line before entering, which has a higher success rate than directly chasing the breakout, and the stop loss is also tighter.
Overall Session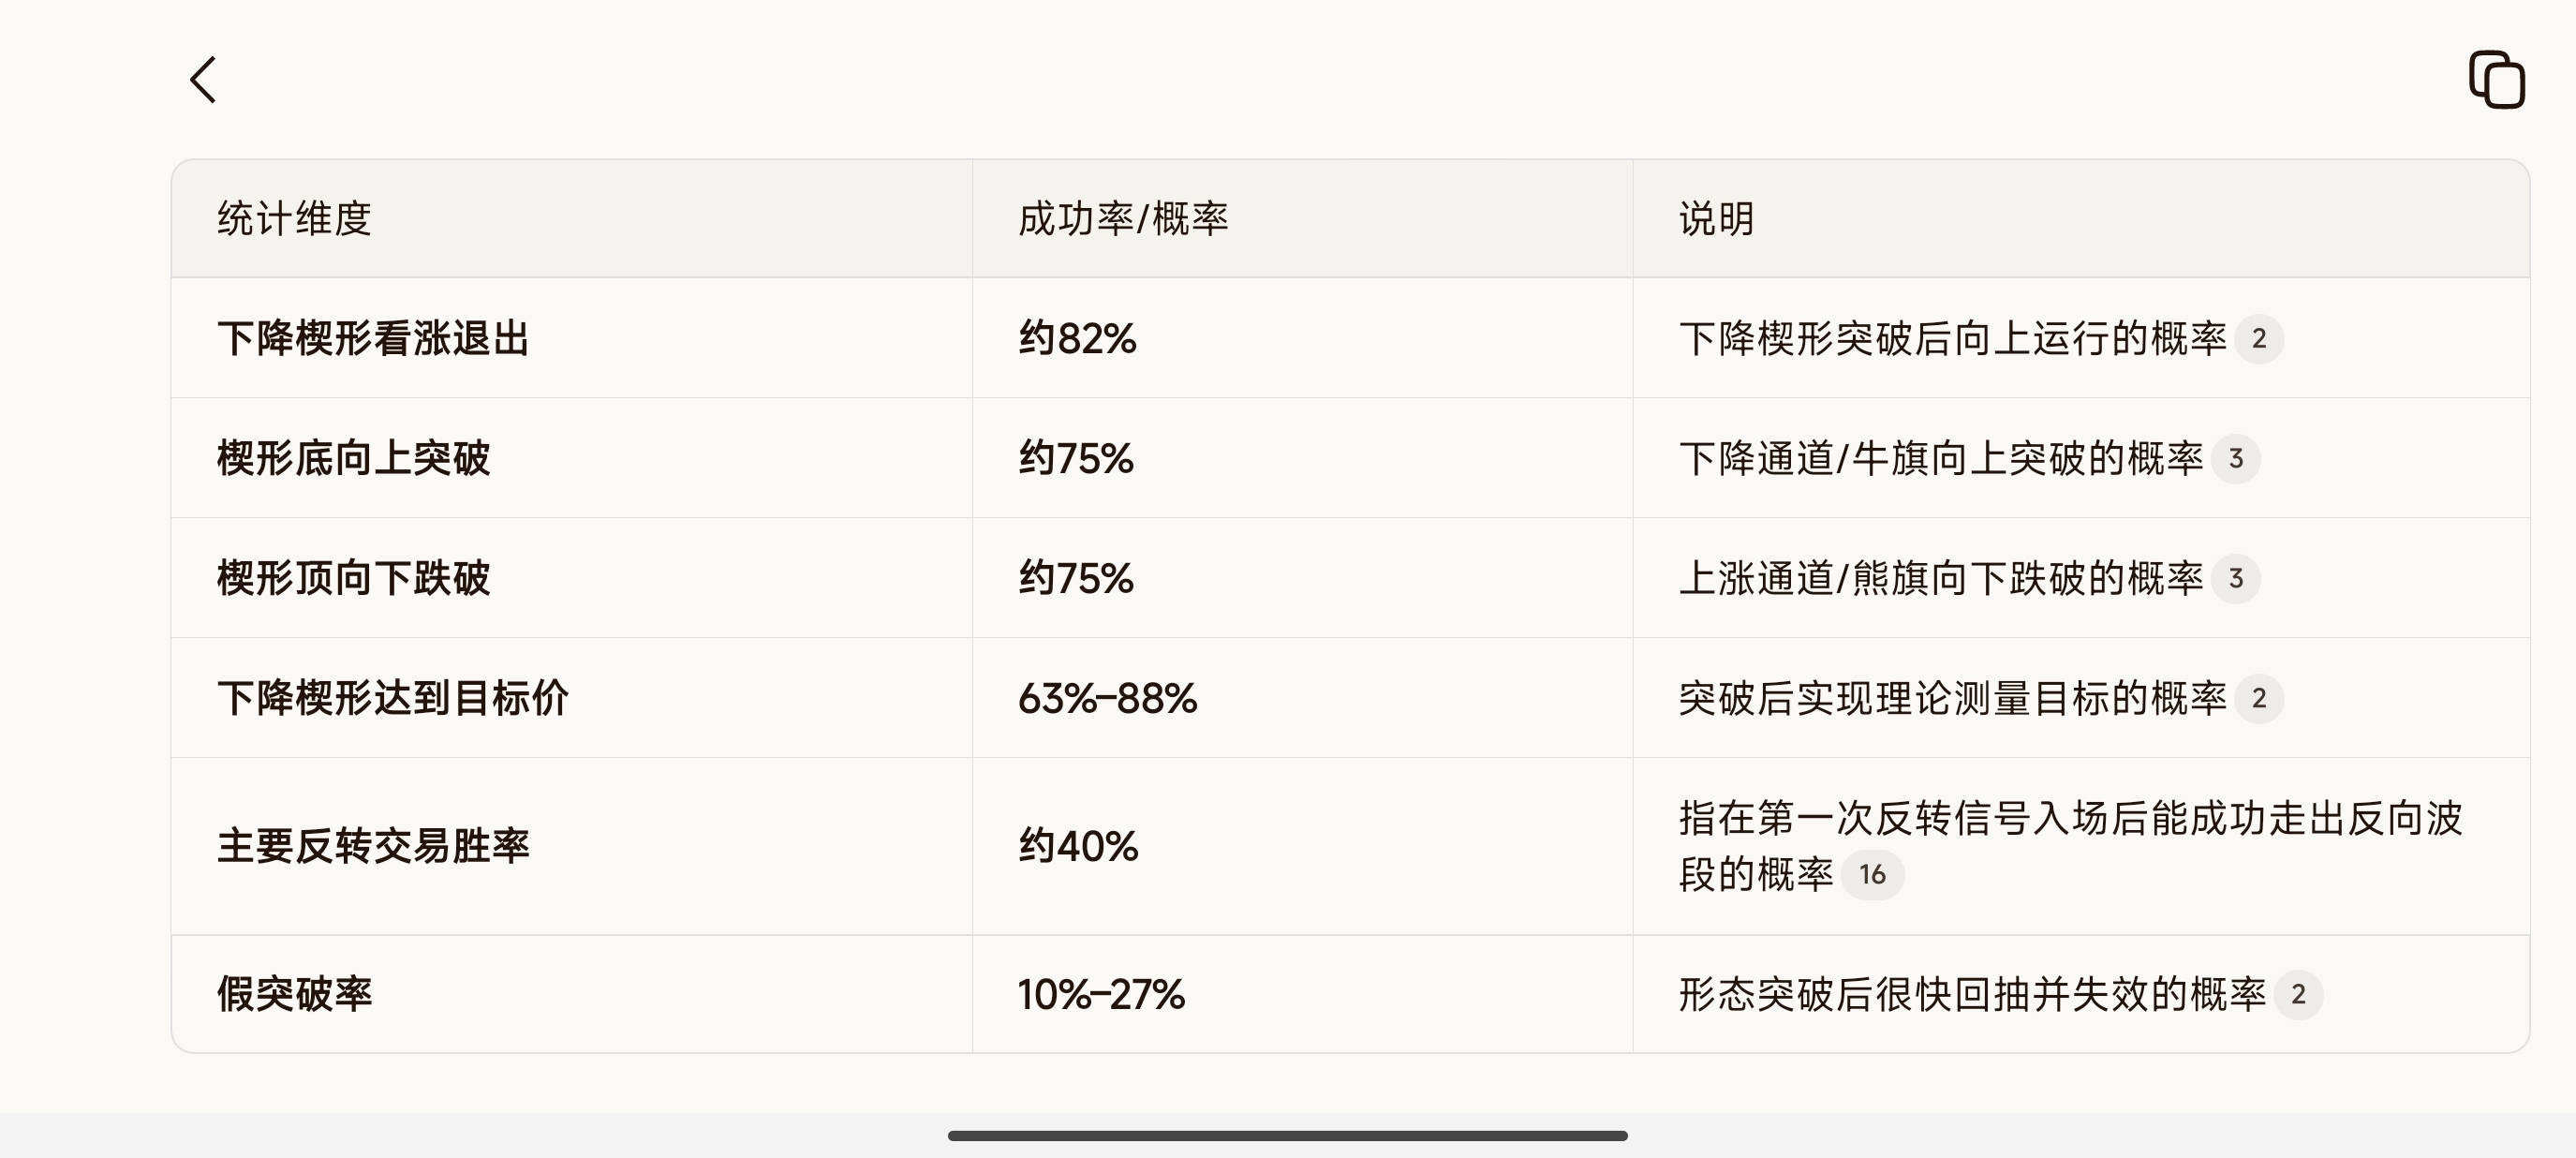
The wedge reversal itself is a high-probability pattern (especially, the bullish breakout of a descending wedge is about 82%), but the success rate of directly trading the first reversal signal is relatively low (about 40%). The key is to patiently wait for a second confirmation signal (such as a second entry point, volume breakout, or pullback confirmation) and to apply strict stop-loss management to convert the statistical advantage into actual trading success rate.