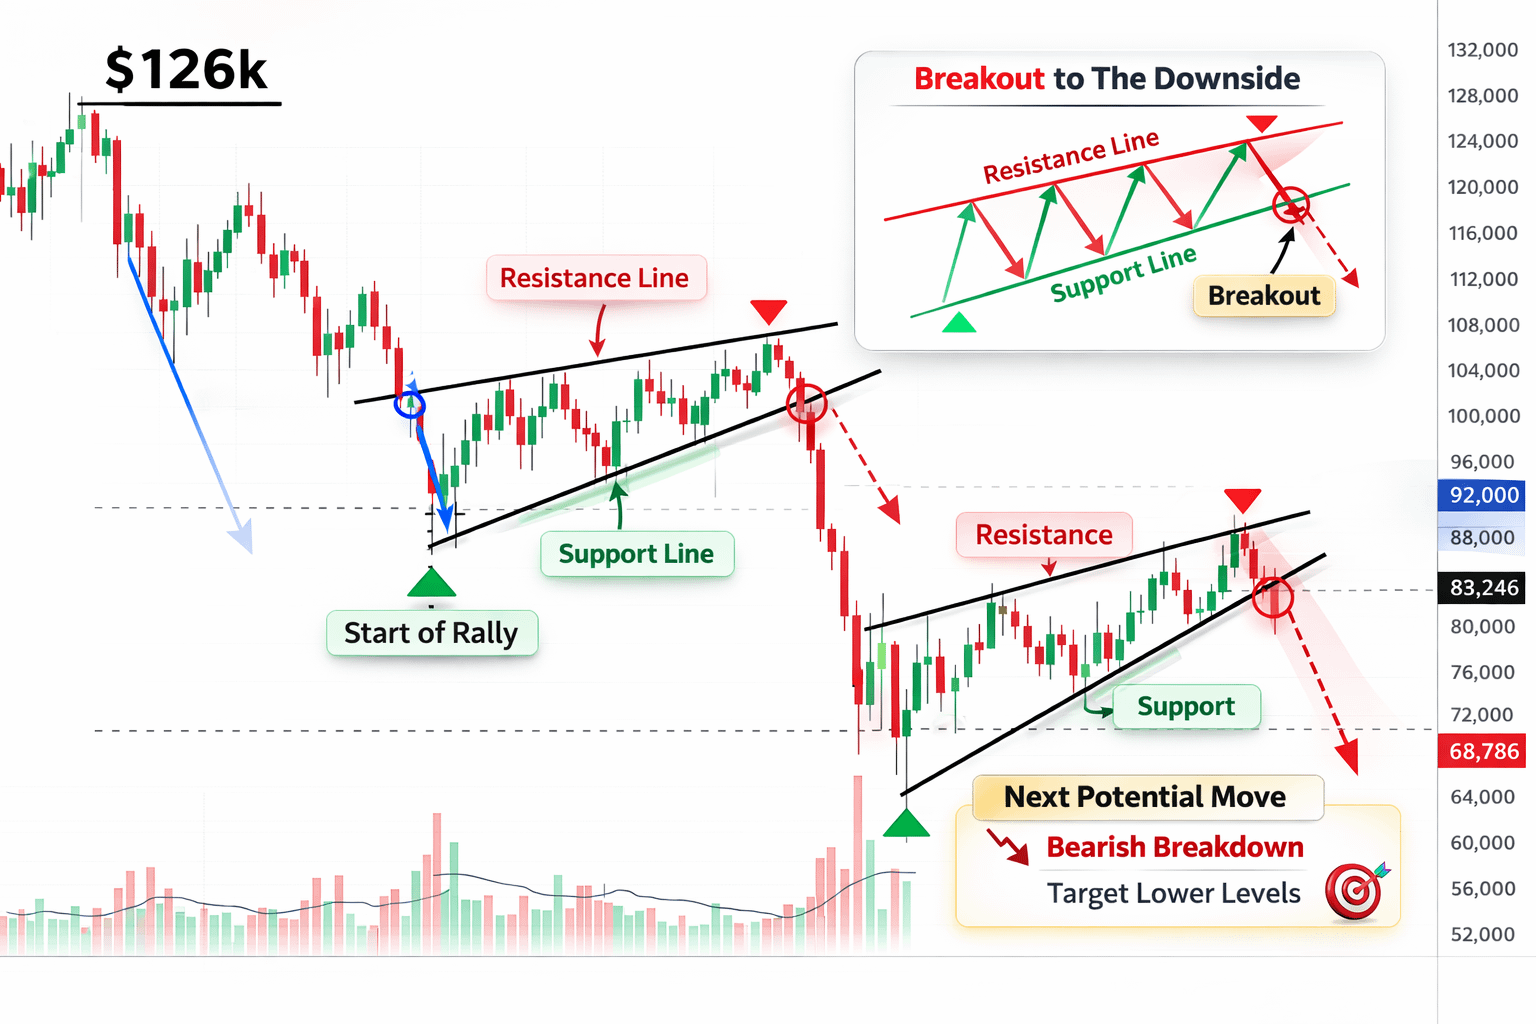
$BTC is starting to trace a pattern that deserves attention.
Not because the shape itself is unusual, but because the market has reacted to a very similar structure before. The last time this setup appeared, Bitcoin went through a fairly sharp correction — roughly a 30% decline — before eventually finding a new equilibrium.
Looking at the current chart, a second flag-like formation seems to be developing after the recent drop. Structurally, this type of pattern often emerges when the market pauses after a strong downward move. Price begins to drift upward slowly, volatility contracts, and the chart appears calmer for a short period.
However, in many cases this kind of recovery phase doesn’t necessarily signal a true reversal. It can simply represent a temporary pause where the market stabilizes before deciding whether to continue the previous trend.
From a liquidity perspective, these rebounds often attract short-term buyers who interpret the move as the beginning of a recovery. At the same time, stops and defensive positioning tend to accumulate below the consolidation area. If buying pressure is not strong enough to break the current structure, those liquidity pockets can later become targets for another move.
Psychologically, this is where markets often become misleading. A modest rebound after a decline can quickly shift sentiment from fear to cautious optimism. But unless the market starts reclaiming key resistance levels with convincing momentum, that optimism may remain fragile.
For now, the main focus is whether buyers can actually disrupt the structure that is forming. If the market manages to break above the flag and sustain higher levels, the bearish implications weaken. But if the pattern continues to develop in the same way as before, the possibility of another volatile phase cannot be ignored.
At this stage, caution still feels appropriate while monitoring how Bitcoin behaves around the next important support areas.
