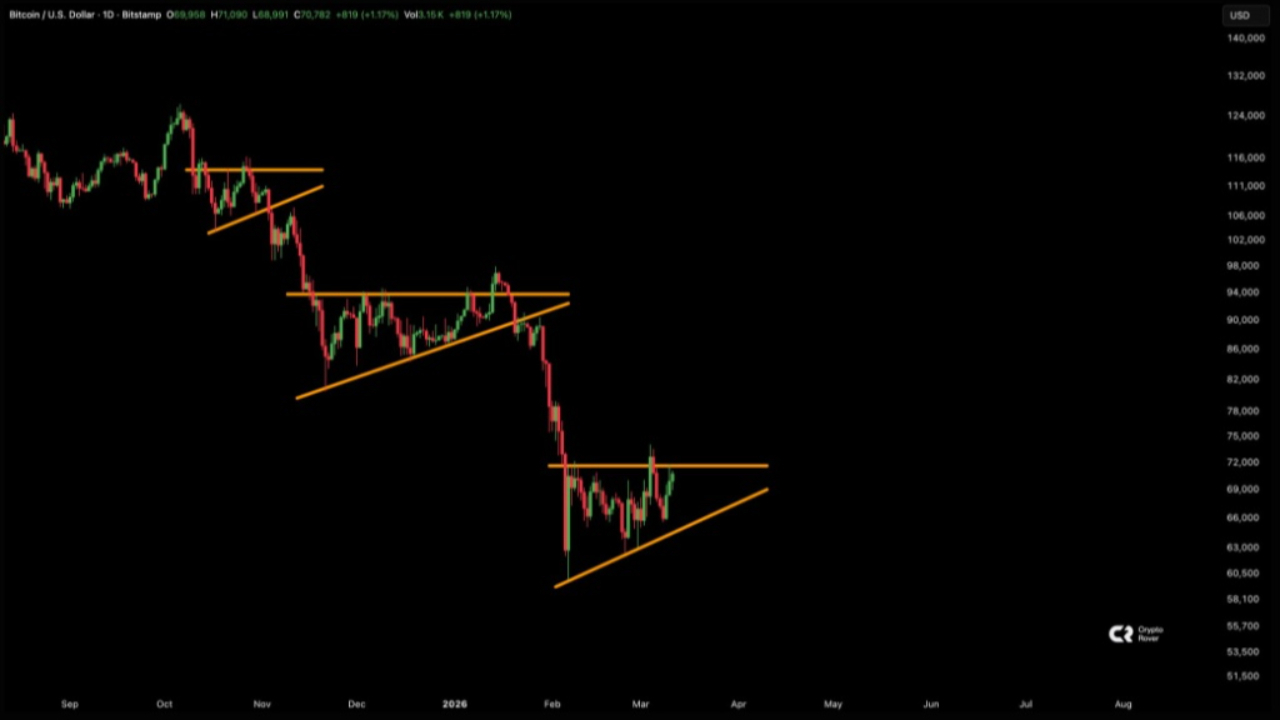
Do you see anything strange on the Daily chart of $BTC ? A Fractal structure (repeating pattern) is clearly visible, and if history repeats itself, we need to prepare for a bad scenario.
🔥 Decoding the "Death Triangle" pattern
Looking at the 3 orange areas that I have marked, the scenario always unfolds in exactly 4 steps:
Free fall: A strong dump begins.
Liquidity recovery: The price creates a lower high after the previous low (looks very much like it is about to rise).
Hitting the ceiling: Firmly rejected at the horizontal resistance.
Collapse: Breaking the lower edge of the triangle and plummeting uncontrollably.
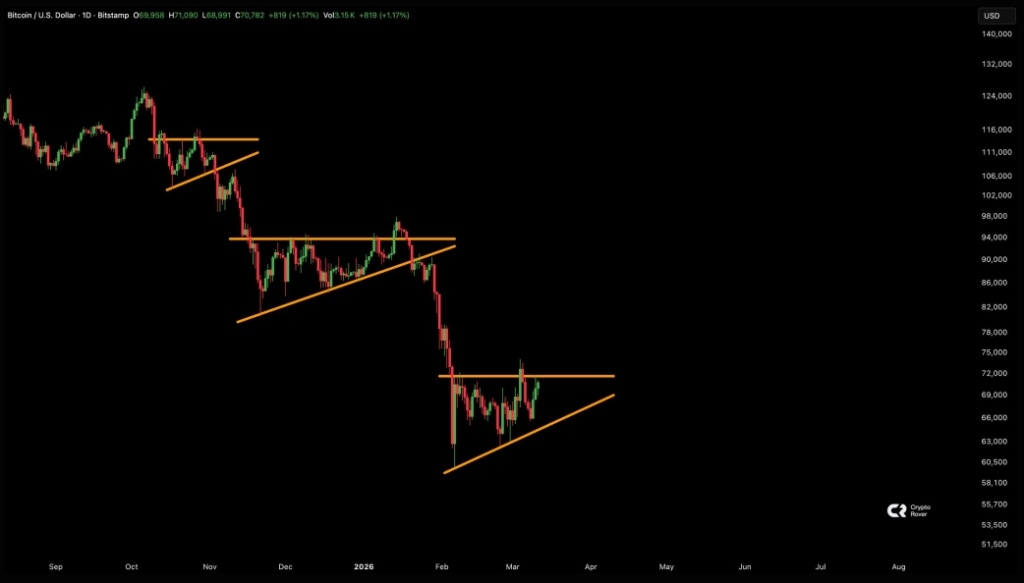
📉 Two "Survival" scenarios at this time:
Scenario 1: Repeating Fractal (Bearish)
If BTC breaks the $66k – $67k zone: A drop to $60k or even $58k is entirely possible. This is when the Bears complete the model for the third time.
Scenario 2: Breaking the rules (Bullish)
Only if BTC strongly breaks through the $72k threshold with a large trading volume, can we declare this Fractal model invalidated. The target then will be $80k+.
💡 Advice for fellow Traders:
No "All-in" here: This price zone is extremely sensitive, wait for trend confirmation (a clear break up or down).
Risk management: If you are holding a Long position, you must have a Stoploss below $66k.
Observe Volume: If the price is moving sideways while Volume decreases, that is usually a sign of a storm coming.
💬 Do you believe in history (Fractal) or think that this time BTC will be different? Leave your comment for discussion!
#BTC #fractal #TechnicalAnalysis #BinanceSquare #tradingStrategy $BNB


