Why is it a 5-3 structure?
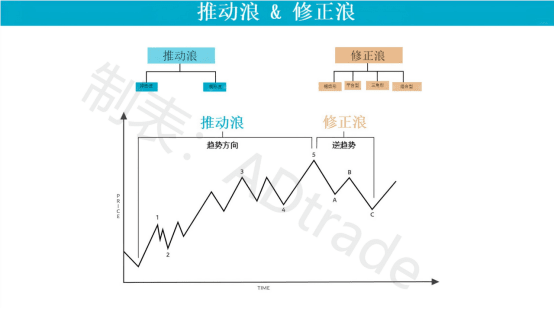
The core assumption of the Elliott Wave Theory is that the basic rhythm of market trends is a structure of '5 up and 3 down'. Simply put, Elliott found that the stock market flows like the tide, rising and falling, forming a sense of rhythm. He summarized a rule: the market usually first moves in five waves in the same direction (for example, five waves up), and then retraces three waves.
He did not delve into why the market operates this way, nor did he analyze the psychological motivations or natural laws, but directly observed that this pattern indeed exists and recurs.
You can think of it this way: if the market remained unchanged from start to finish, the price chart would just be a horizontal line, and there would be no visible 'progress' of ups and downs. A real trend must advance through ups and downs. This '5 advances 3 retreats' wave structure is the rhythm that the market must experience in its progression.
So, every time you see the market strongly advancing in five waves, the next likely phase will be a three-wave adjustment; this is the natural breathing of the market.
The 5-3 wave structure is the most fundamental form of illustration, capable of reflecting the necessary rhythm of market ups and downs while balancing price fluctuations and the overall trend—whether it's an upward trend or a downward trend. For instance, a 3-1 structure cannot present such a trend.
The key is that this wave cycle does not exist in isolation but is part of a larger fractal structure. Whenever a complete 5-3 wave ends, it is usually expected that the next cycle will begin, continuing the rhythm of the market. After a correction is completed, the continuity of market forces means that the next set of five-wave structures is about to take shape.
The reason this structure can exist long-term is believed to resonate with the golden ratio. The tendency of 5-3 can be seen as an embodiment of the golden ratio, and this proportional principle is universally present in nature and man-made systems, representing a balance and harmony aesthetic. Research also suggests that the collective consciousness and decision-making processes of humans may naturally tend to follow mathematical constants like the golden ratio, which could also be the fundamental reason for the recurring 5-3 wave structure in the market.
Therefore, Elliott Wave Theory is not just a technical analysis tool, but a perspective to observe the interactions between human behavior, natural laws, and economic movements. It reveals that in the process of seeking balance and proportion, the market reflects the inherent changes and evolutionary patterns of our inner minds and the surrounding world, continually advancing and correcting in a self-repetitive, rhythmically distinct manner.
The 5-3 wave structure emphasizes not only the golden ratio but also the market's ability to resist noise, reminding us to recognize the fractal characteristics of the market—this characteristic is highly consistent with the patterns of growth, development, and adjustment in nature and human activities. It is a portrayal of 'the market and nature fundamentally operate based on rhythm and structure.'
Is Elliott Wave Theory a trading system?
Understanding the positioning of Elliott Wave analysis:
Elliott Wave Theory (Elliott Wave Principle) is a valuable tool for traders to understand and predict market trends. However, it is necessary to clarify its positioning within a broader market analysis system. As Frost and Prechter pointed out in their works: Elliott Wave Theory is not a complete independent trading system, but a highly valuable analytical framework. They emphasize that 'the main value of wave theory lies in providing a background framework for market analysis.'
Therefore, it is important to be clear: although wave theory can deepen our understanding of market dynamics, it does not directly provide buy or sell signals or trading instructions.
Common misconceptions:
Many mistakenly believe that Elliott Wave Theory can be used as a complete trading strategy. In reality, it is more suitable for retrospectively interpreting market movements rather than serving as a direct trading signal generator.
Its strength lies in identifying market patterns and making predictions about potential future directions based on historical and current structures.
Integrating Elliott Wave Theory into your trading strategy:
To effectively use wave theory, traders should combine it with their existing trading systems or strategies. This integration can significantly improve the quality of trading decisions, especially in judging entry and exit timing.
Here are some examples of integration:
Identifying trends:
The core function of Elliott Wave Theory is to identify the main trends in the market through wave structures. These wave patterns can reveal whether a market movement is in line with the main trend or is a counter-trend (correction). Counter-trends often come with higher risks. Identifying these structures helps traders seize potential opportunities while avoiding unnecessary high-risk trades.
Seizing entry and exit opportunities:
Elliott Wave Theory is particularly useful in determining the timing of the end of market corrections, which often means that the main trend will restart, making it an ideal time for entry trades.
In addition, the theory can also provide signals that trends may weaken or reverse, which is important for formulating exit plans, locking in profits, tightening stop losses, or adjusting positions.
Using Fibonacci tools to improve analytical precision:
Combining Elliott Wave Theory with Fibonacci analysis can further enhance the accuracy of trading decisions.
Fibonacci tools (such as retracement levels, extension levels, etc.) combined with wave structures help predict potential reversal zones and set realistic price targets—whether it's the end of a corrective wave or the continuation of a trend wave.
This combination not only enhances the accuracy of predictions but also helps traders clarify their entry and exit points.
Although Elliott Wave Theory itself is not a complete trading system, as an analytical framework, it can provide deeper market insights and judgments when combined with other tools (such as Fibonacci analysis).
Why does the market look so 'chaotic'?—In fact, that is the embodiment of order +++
One question I often get asked is: why does the market always seem so messy?
Some even question whether Elliott Wave Theory is 'effective' because market movements often appear chaotic and disordered.
But one point that people often overlook is: chaos and order are not opposites; they are actually a pair of symbiotes.
The universe itself is built upon a hidden structure: chaos gives birth to new patterns, while order reveals itself in an ever-changing cycle.
Understanding this deeper reality will allow us to view the market from a new perspective.
On the surface, financial markets do seem unpredictable and randomly fluctuating.
But the deeper truth is: without chaos, we cannot recognize order.
It is precisely because of the existence of contrast that structure becomes apparent—this applies not only to the market but to life as a whole.
This pattern is visible everywhere in nature:
When we zoom in or out, what we see is completely different.
For example, when zooming in on a drop of water, we can see the molecules arranged in an orderly fashion; pulling back a bit, rivers appear turbulent and chaotic; further out, we find that water has quietly shaped the contours of mountains over thousands of years.
From the movement of planets to the birth of stars, the universe flows between chaos and order.
Financial markets actually follow the same rhythm.
When we analyze a chart—whether it's a 15-minute short-term chart or a weekly cycle chart—we always see structures at a certain specific scale.
Sometimes we can clearly see clean and sharp impulse waves, penetrating the noise of the market like a melody;
sometimes we face tangled and complex corrective waves, with unclear directions, making trading difficult.
And Elliott Wave Theory is the tool that helps us find 'deep order' amid this 'surface chaos.'
It is like a magnifying glass that clarifies hidden rhythms.
It cannot promise absolute certainty—there is no tool in this world that can do that;
but it can significantly reduce uncertainty and help us identify structures beneath the surface.
Let's try to understand it in another way:
The traffic congestion during rush hour may seem chaotic, but from a bird's eye view of the entire city road system, an orderly pattern can be seen.
Boiling water appears chaotic on the surface, but countless molecules move in an orderly fashion within a stable structure.
A cryptocurrency chart may look disorganized, but Elliott Waves can reveal the underlying rhythm.
Elliott Wave analysis can also help us determine our position within a larger structure:
At what level of 'chaos' are we currently?
From which angle is order beginning to emerge?
When we realize we are in a corrective wave, it may be wiser to be more cautious or choose not to trade;
but when a clear impulse wave unfolds, opportunities often arise, increasing the probability of success.
Understanding the balance between chaos and order is a powerful tool—it not only applies to trading but also helps us stay in sync with the natural rhythm of the market.
Ultimately, those things that seem 'random' at a certain level are merely a part of a grander dance.
A wave may churn unpredictably,
but when you step back, you will see—the ocean has its own direction.
Elliott Wave Theory helps us perceive this deeper tide,
And it reminds us: even when at the center of chaos, there is always a structure quietly waiting to be discovered.
What exactly is Elliott Wave?
In the community, we often see a viewpoint: Elliott Waves seem like a strict 'rule handbook' that lists what is 'allowed' and what is not. But this is actually a misunderstanding.
Elliott Waves are not a set of legal provisions but an analytical framework.
It is a tool that helps us visualize market psychology. It reveals how public behavior presents itself in patterns—through the evolution of emotions such as fear, euphoria, doubt, greed, and hope.
The most widely recognized presentation of this framework comes from Robert Prechter's book published in the late 1970s (Elliott Wave Principle). That book became a standard reference text—there's ample reason for this. Without Prechter's research, many would not understand this theory as deeply. So, yes, we are indeed standing on the shoulders of giants.
But (this is crucial) that book was written based on the charts and data at the time and has not been updated since. Today's market has undergone tremendous changes: we have better data, faster execution speeds, and entirely new asset classes. To believe that a rule book from the 1970s is still 'meticulously applicable' today is overly idealistic.
Many may not know: R.N. Elliott himself did not establish many 'hard rules.'
His original intention was to 'find structure in chaos'—rather than establish a rigid system.
Many rules we are familiar with today, such as 'B waves in a zigzag cannot exceed the high point of A waves,' are actually interpretations by Prechter, rather than universally applicable truths.
In reality, we do see some 'violating' wave structures:
For example, some B waves do indeed exceed A waves;
or some second waves may appear as triangles—even if the book states that it is not allowed;
and traditional theory says that 'the first and fourth waves in guiding wedge structures must overlap,' but in today's market, this overlap does not always occur.
These are not 'errors' but rather a true reflection of the constantly changing market.
Sometimes I see comments like: 'This does not conform to Elliott Wave rules!'
I completely understand that such comments are often based on a rule from books.
But many people overlook that these rules are not 'absolute truths' but the best perspective based on the data context at the time.
Therefore, this article also wants to say to everyone who is learning Elliott Wave Theory:
Be bold, learn this system, and master various structures.
Once you truly understand the rhythm of the market's operation, if a particular chart provides sufficient reason, allow yourself to occasionally 'break' the rules.
But note: only by truly understanding a rule does it make sense to break it.
If you violate a rule without understanding it, you're just guessing;
but if you know the purpose of the rule and understand when it fails, then adjusting it becomes part of mastering this method.
It's like any craft:
a top chef can adjust a recipe,
a professional musician can improvise on the rhythm—but the premise is that they have mastered the basics.
Learning Elliott Waves is no different.
One tree cannot form a forest, and a lone sail cannot sail far! In the cryptocurrency circle, if you don't have a good circle or first-hand information from the crypto world, I suggest you follow me, and I will help you get on board without cost; welcome to join the team!!!#币安HODLer空投HEMI #永续合约DEX赛道之争 $ETH


