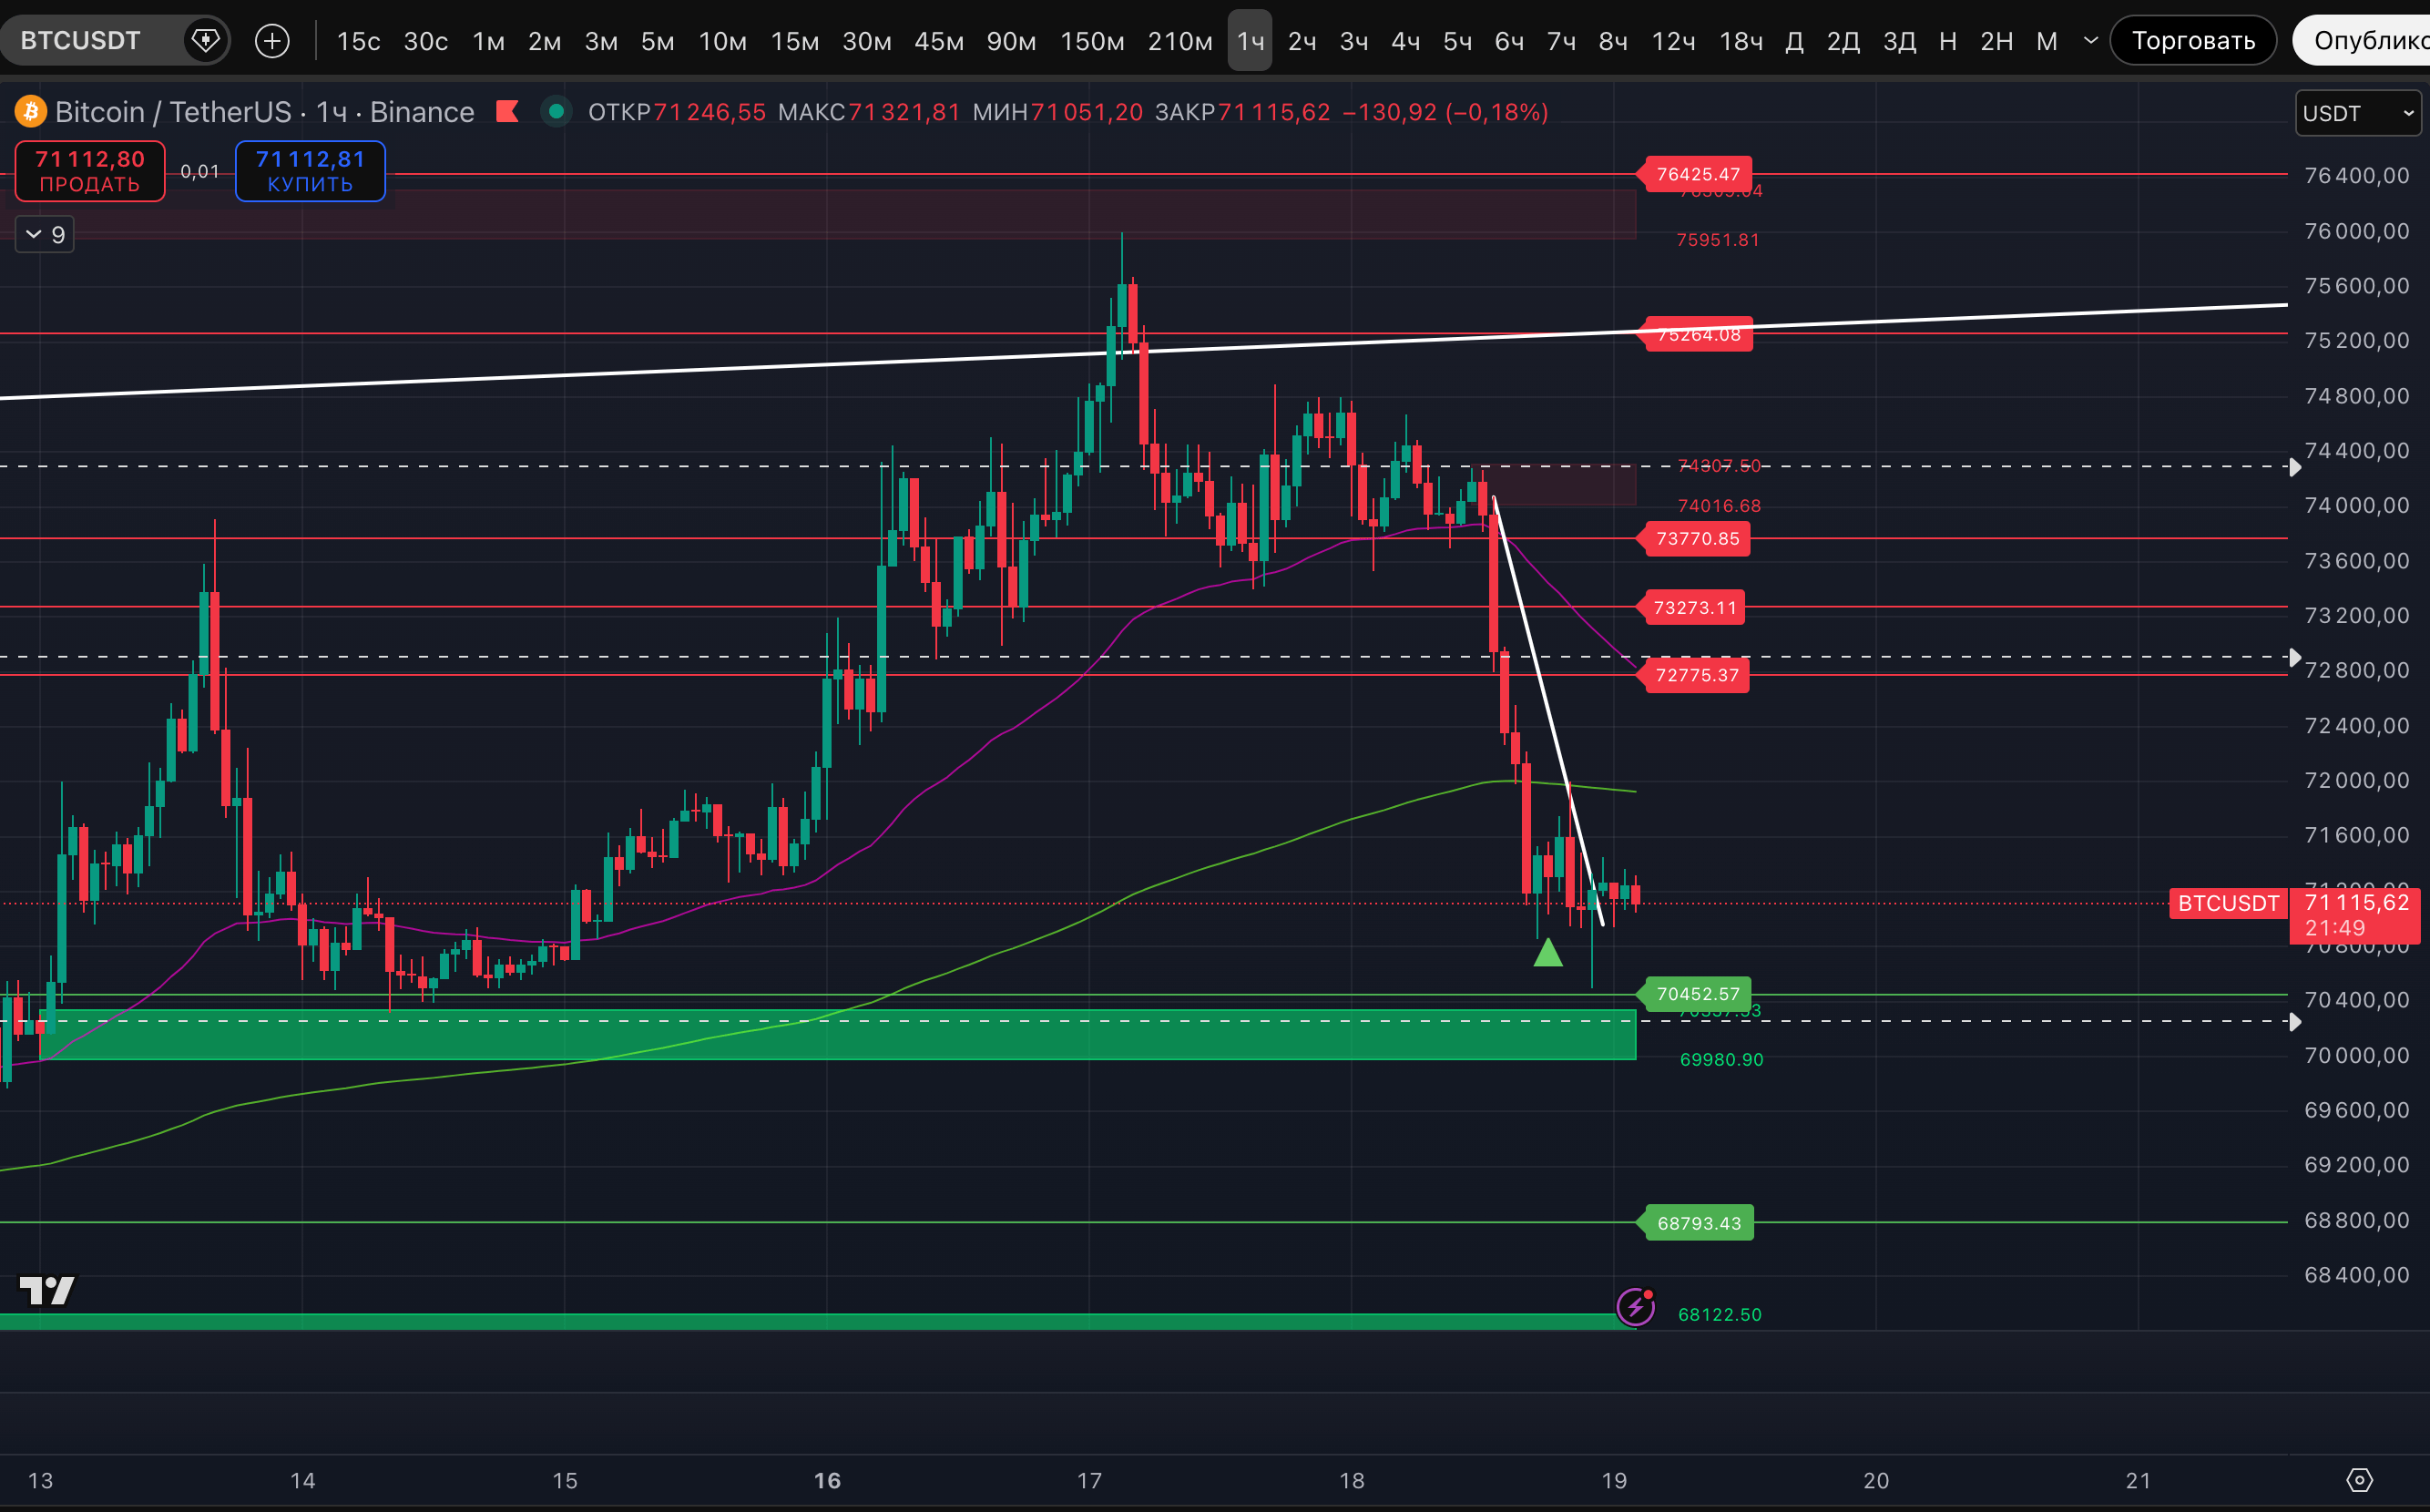
The current low of BTC during the dump is exactly 70,500$. The price literally just barely did not reach the horizontal level of 70,452$.
Many times on March 18, it was pointed out that 70,452$ is the target level for decline and 69,980-70,337$ as the target zone.
From the latest:
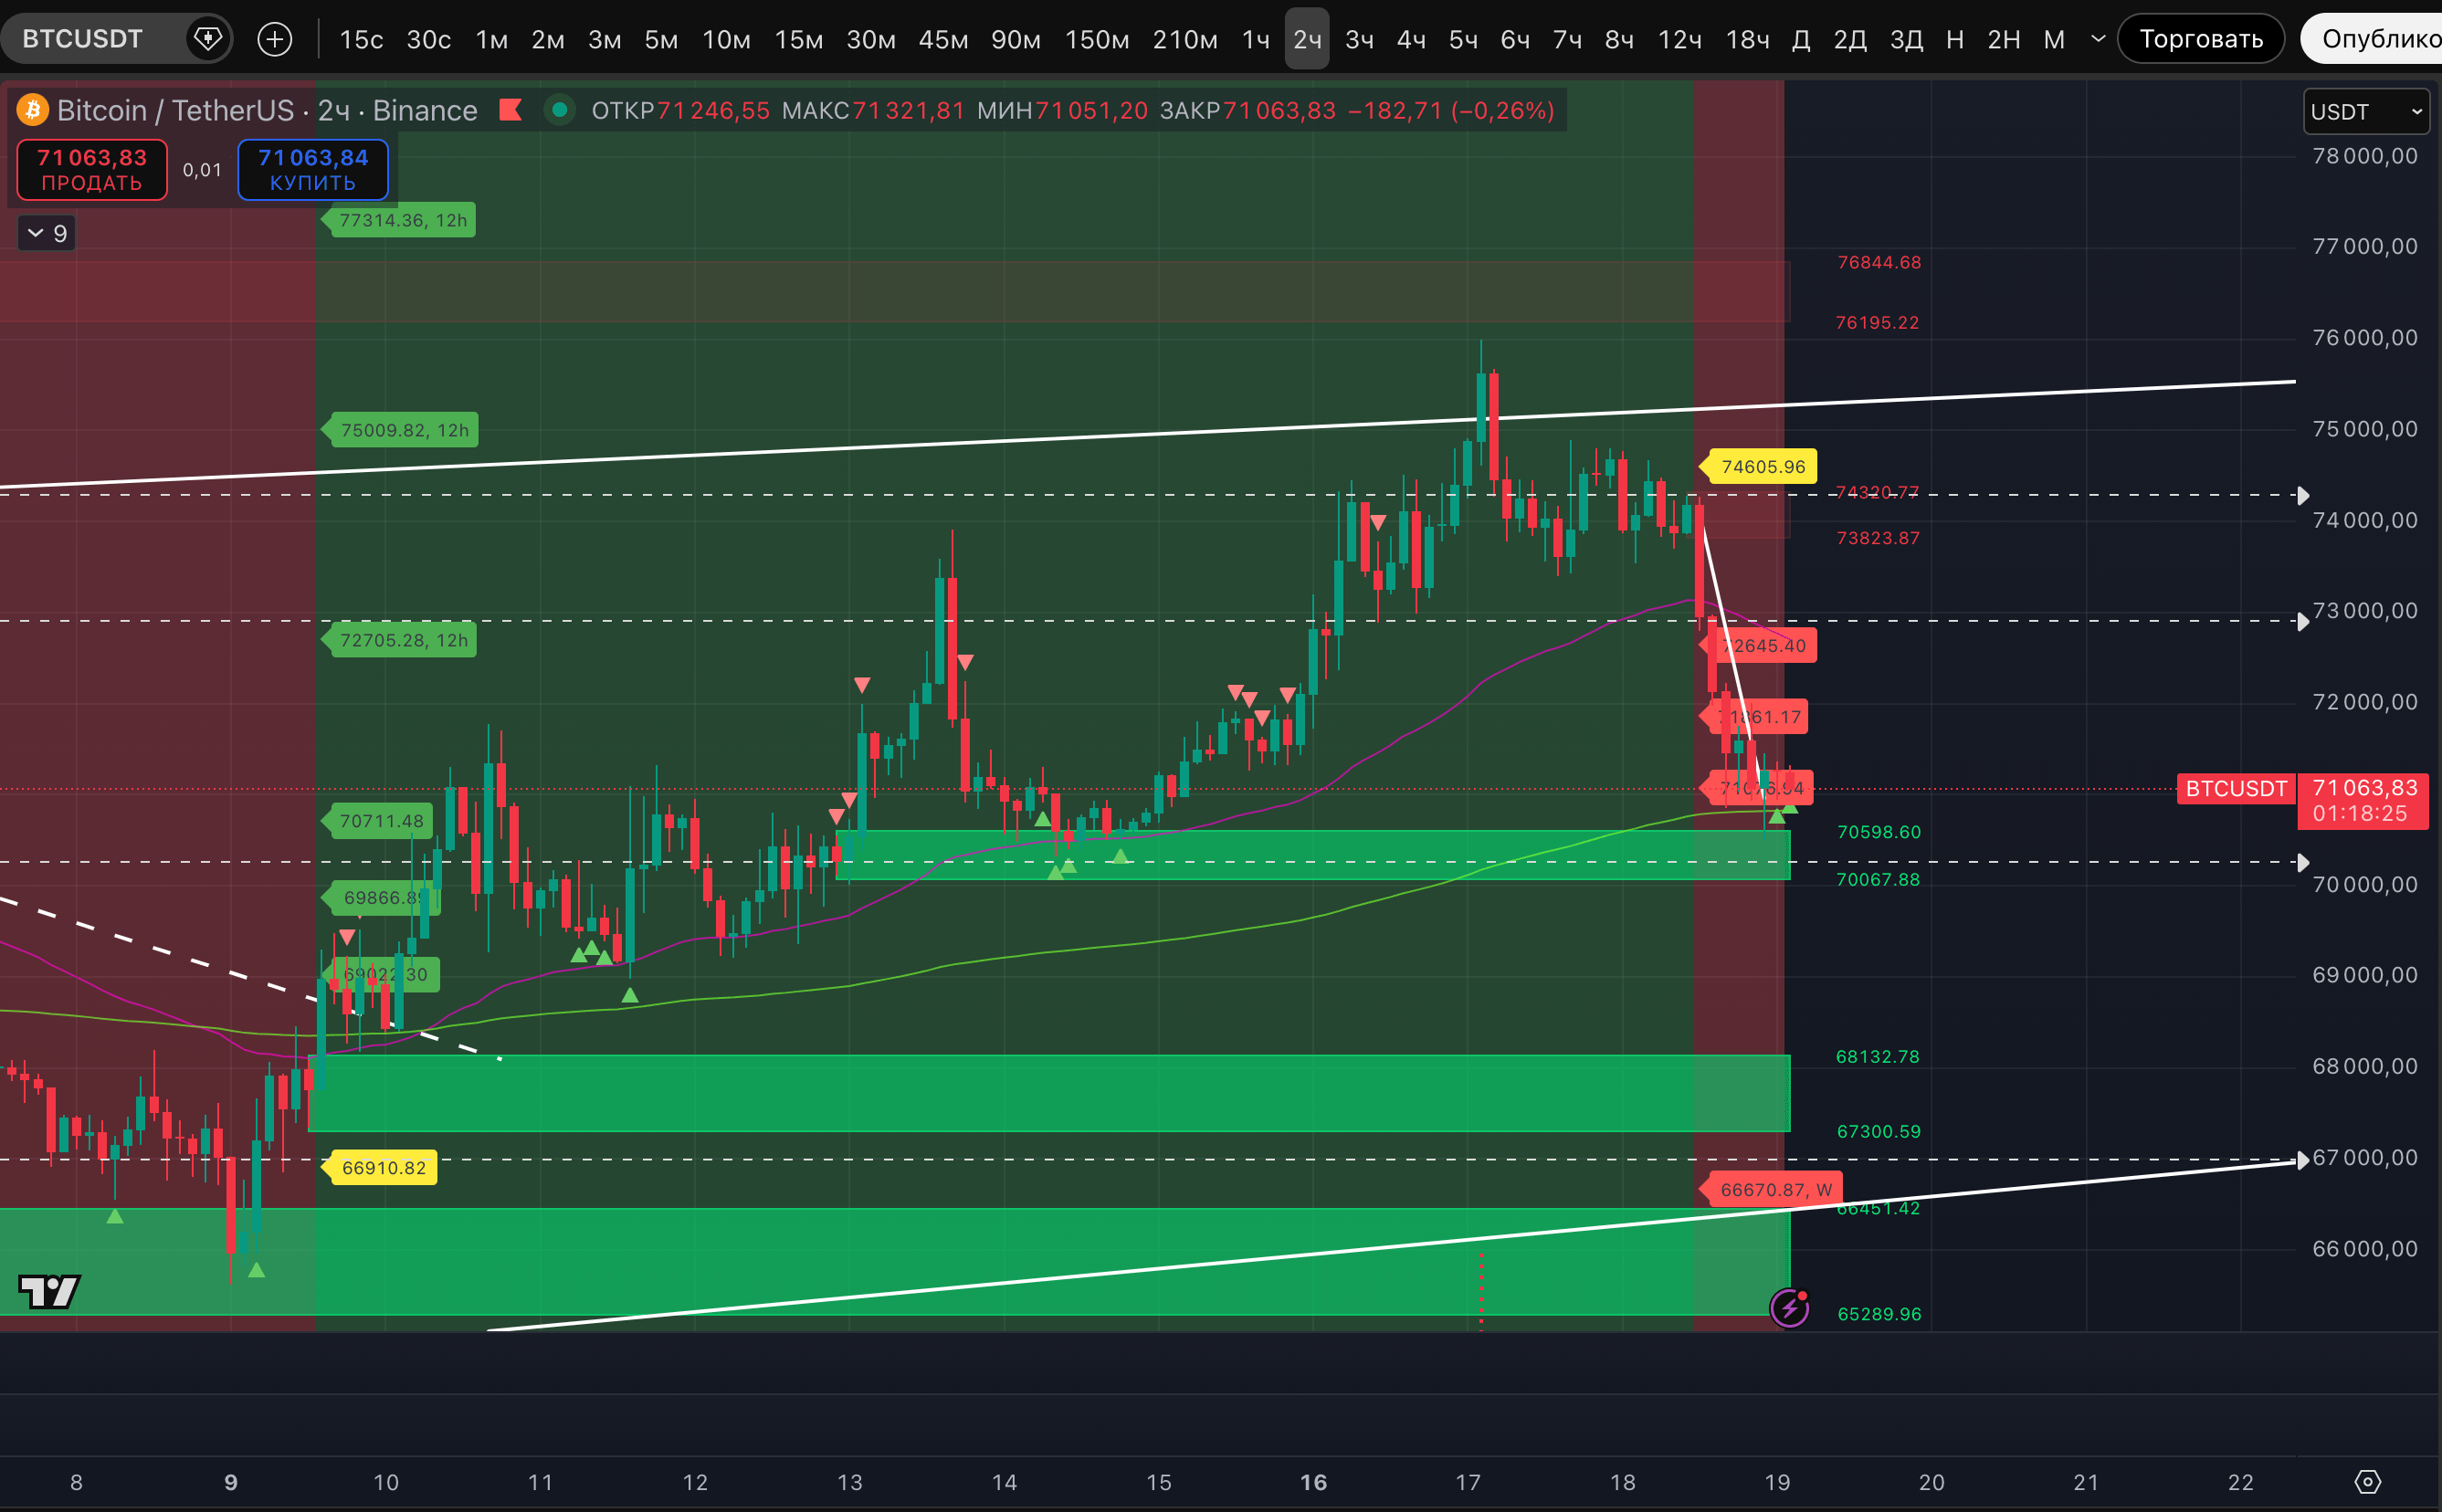
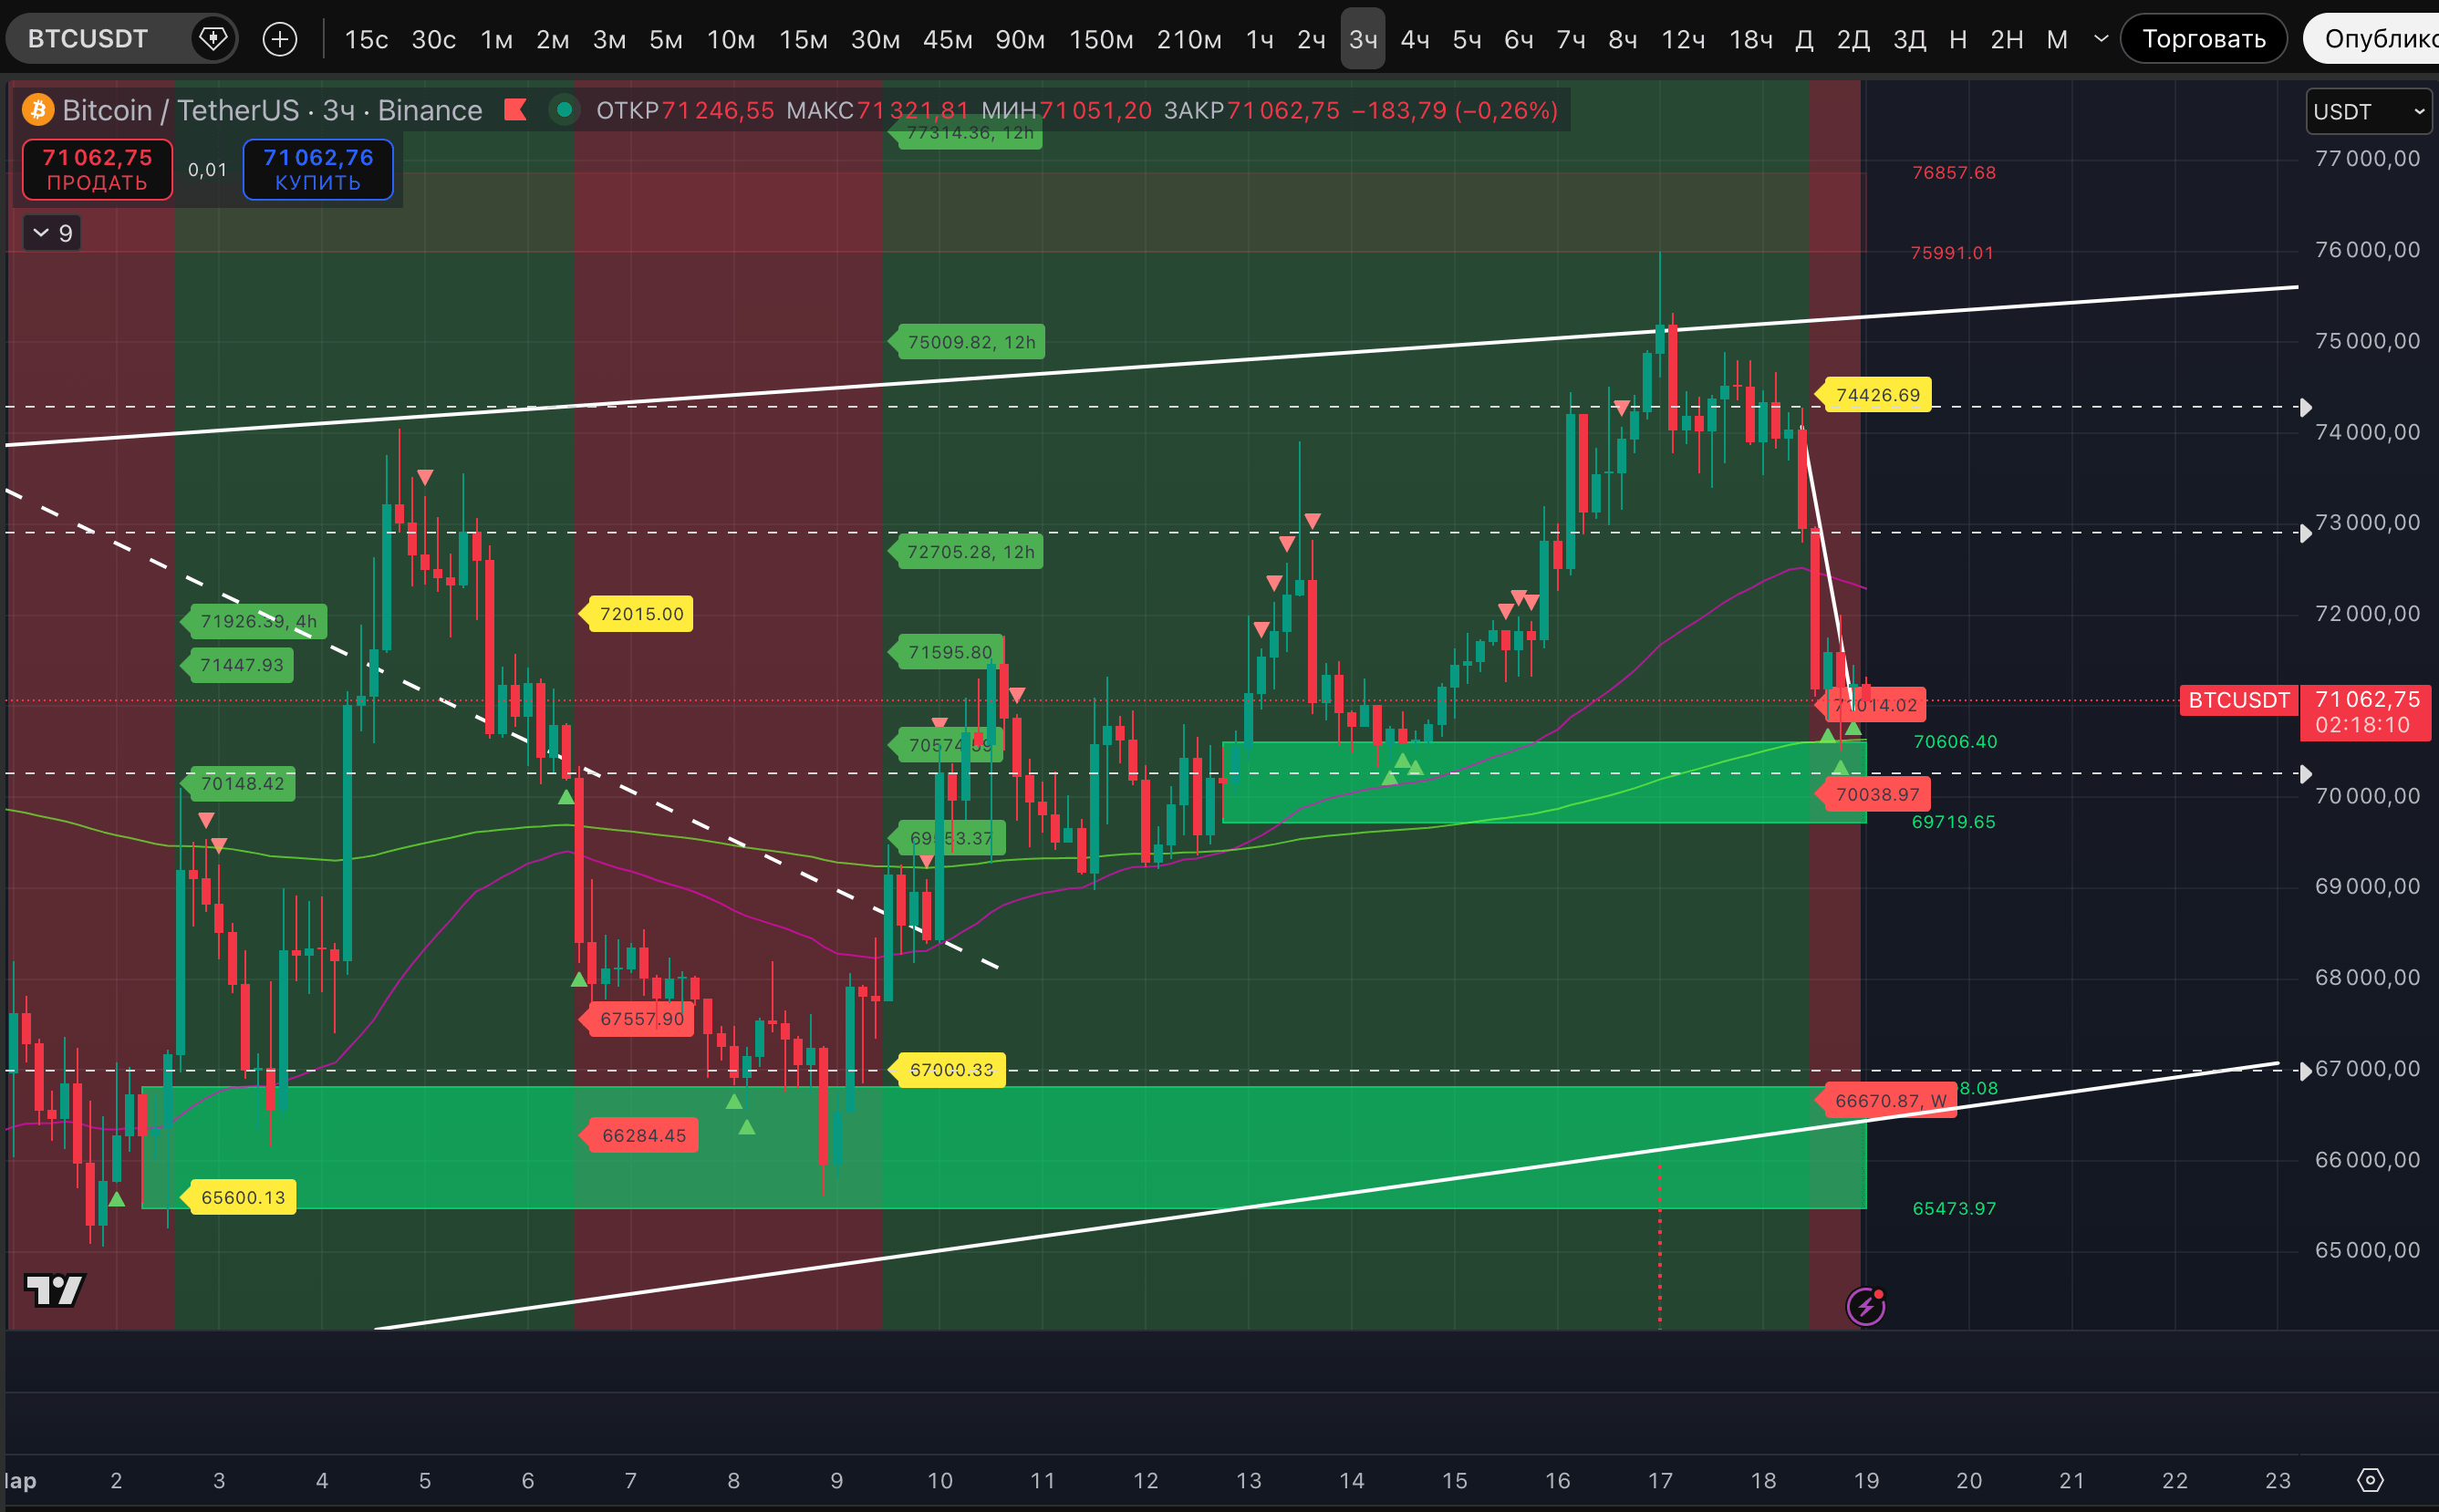
"... On the older time frame, the price broke the support zone of 72,338-72,881$ and now the next one, as already mentioned, is only 69,980-70,337$... In case it doesn't hold at 69,980-70,337$ - this will open the way to the next zone 67,523-68,122$...
... As expected, the breakout at $72,775 led to a move towards $70,452. The level has not yet been reached, but the price is striving for it. Considering the proximity to the zone of $69,980-$70,337 - there is almost no doubt that the price will reach there. The question is whether it will be with a bounce or without...
The fact that these supports have not been tested yet makes us wait for the test. And the question remains relevant - will the price go there after the bounce, or immediately?
Although the Strong signal marks the potential lows on the 30- and 45-minute, hourly TF are partially broken - these signals at least kept the asset from further collapse. At the same time, there are already three regular marks of potential lows on the 3-hour TF. And on the 2-hour TF - two.
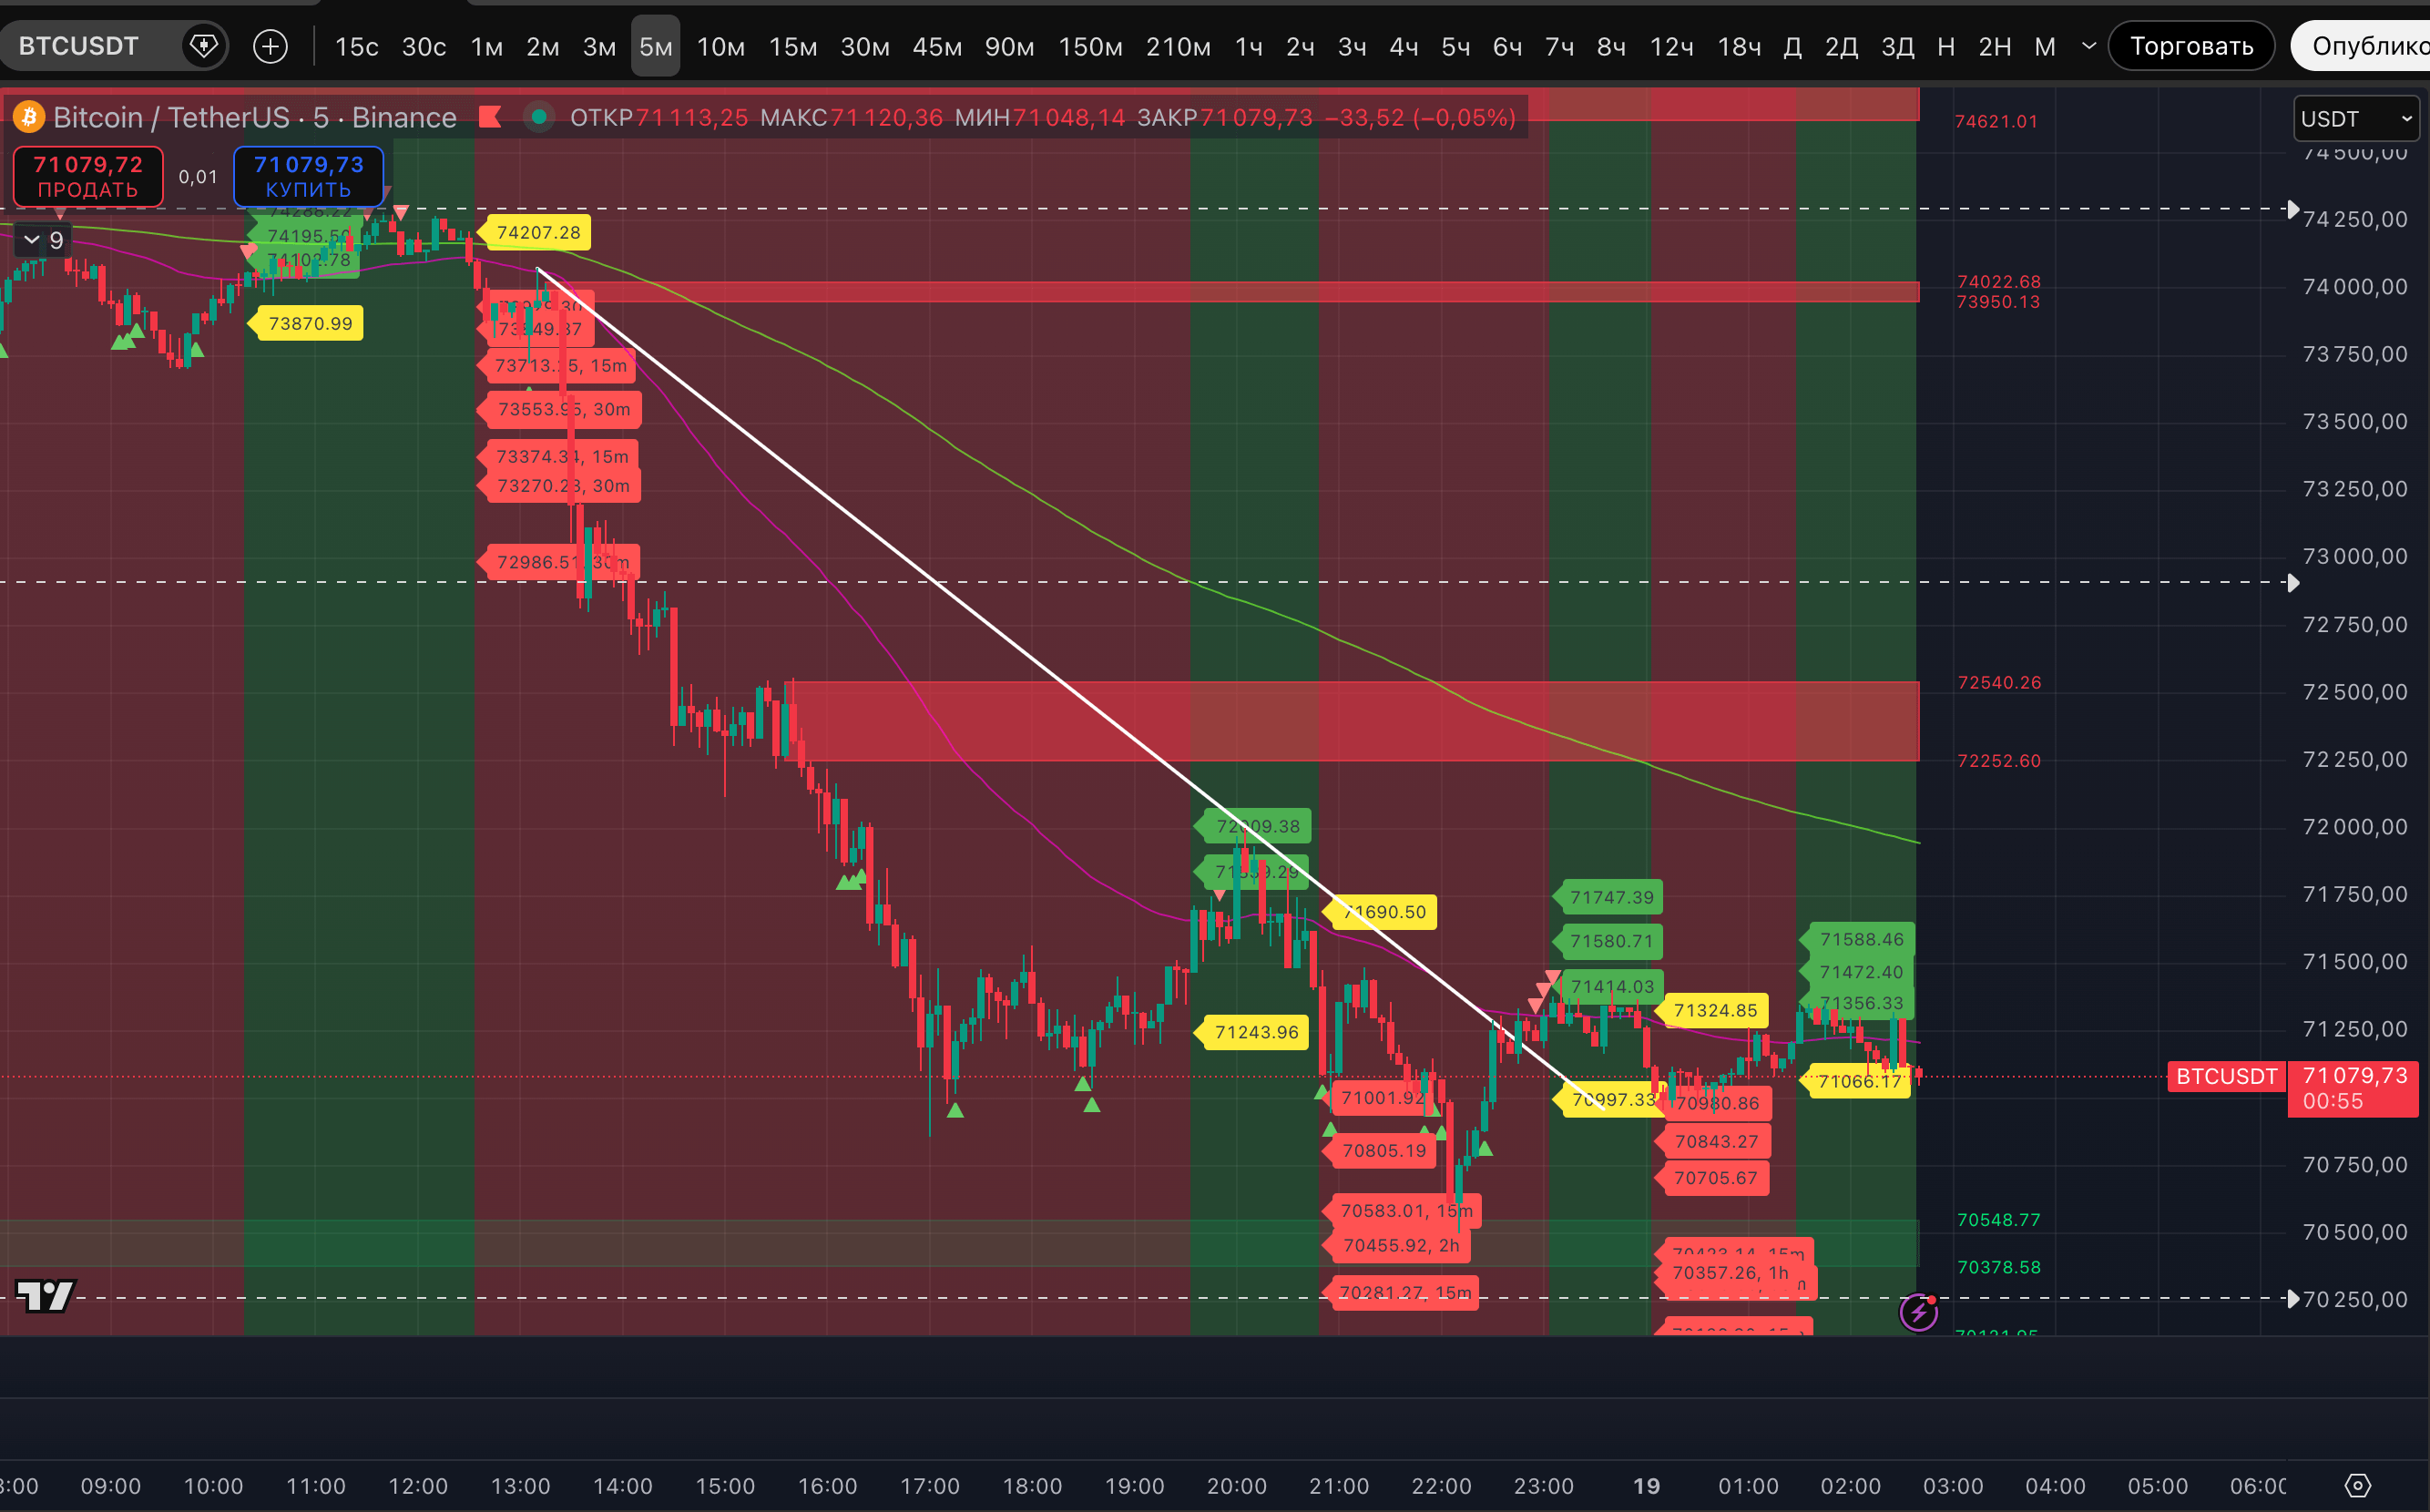
The bounce is trying to start, but so far it is very weak. On the 5-minute TF, a breakout of the trendline is visible, but after that, the price consolidates. The price under the trendline looks like a "Dragon" pattern. But although the pattern started in execution - the range after the breakout of the trendline indicates that it is blurring.
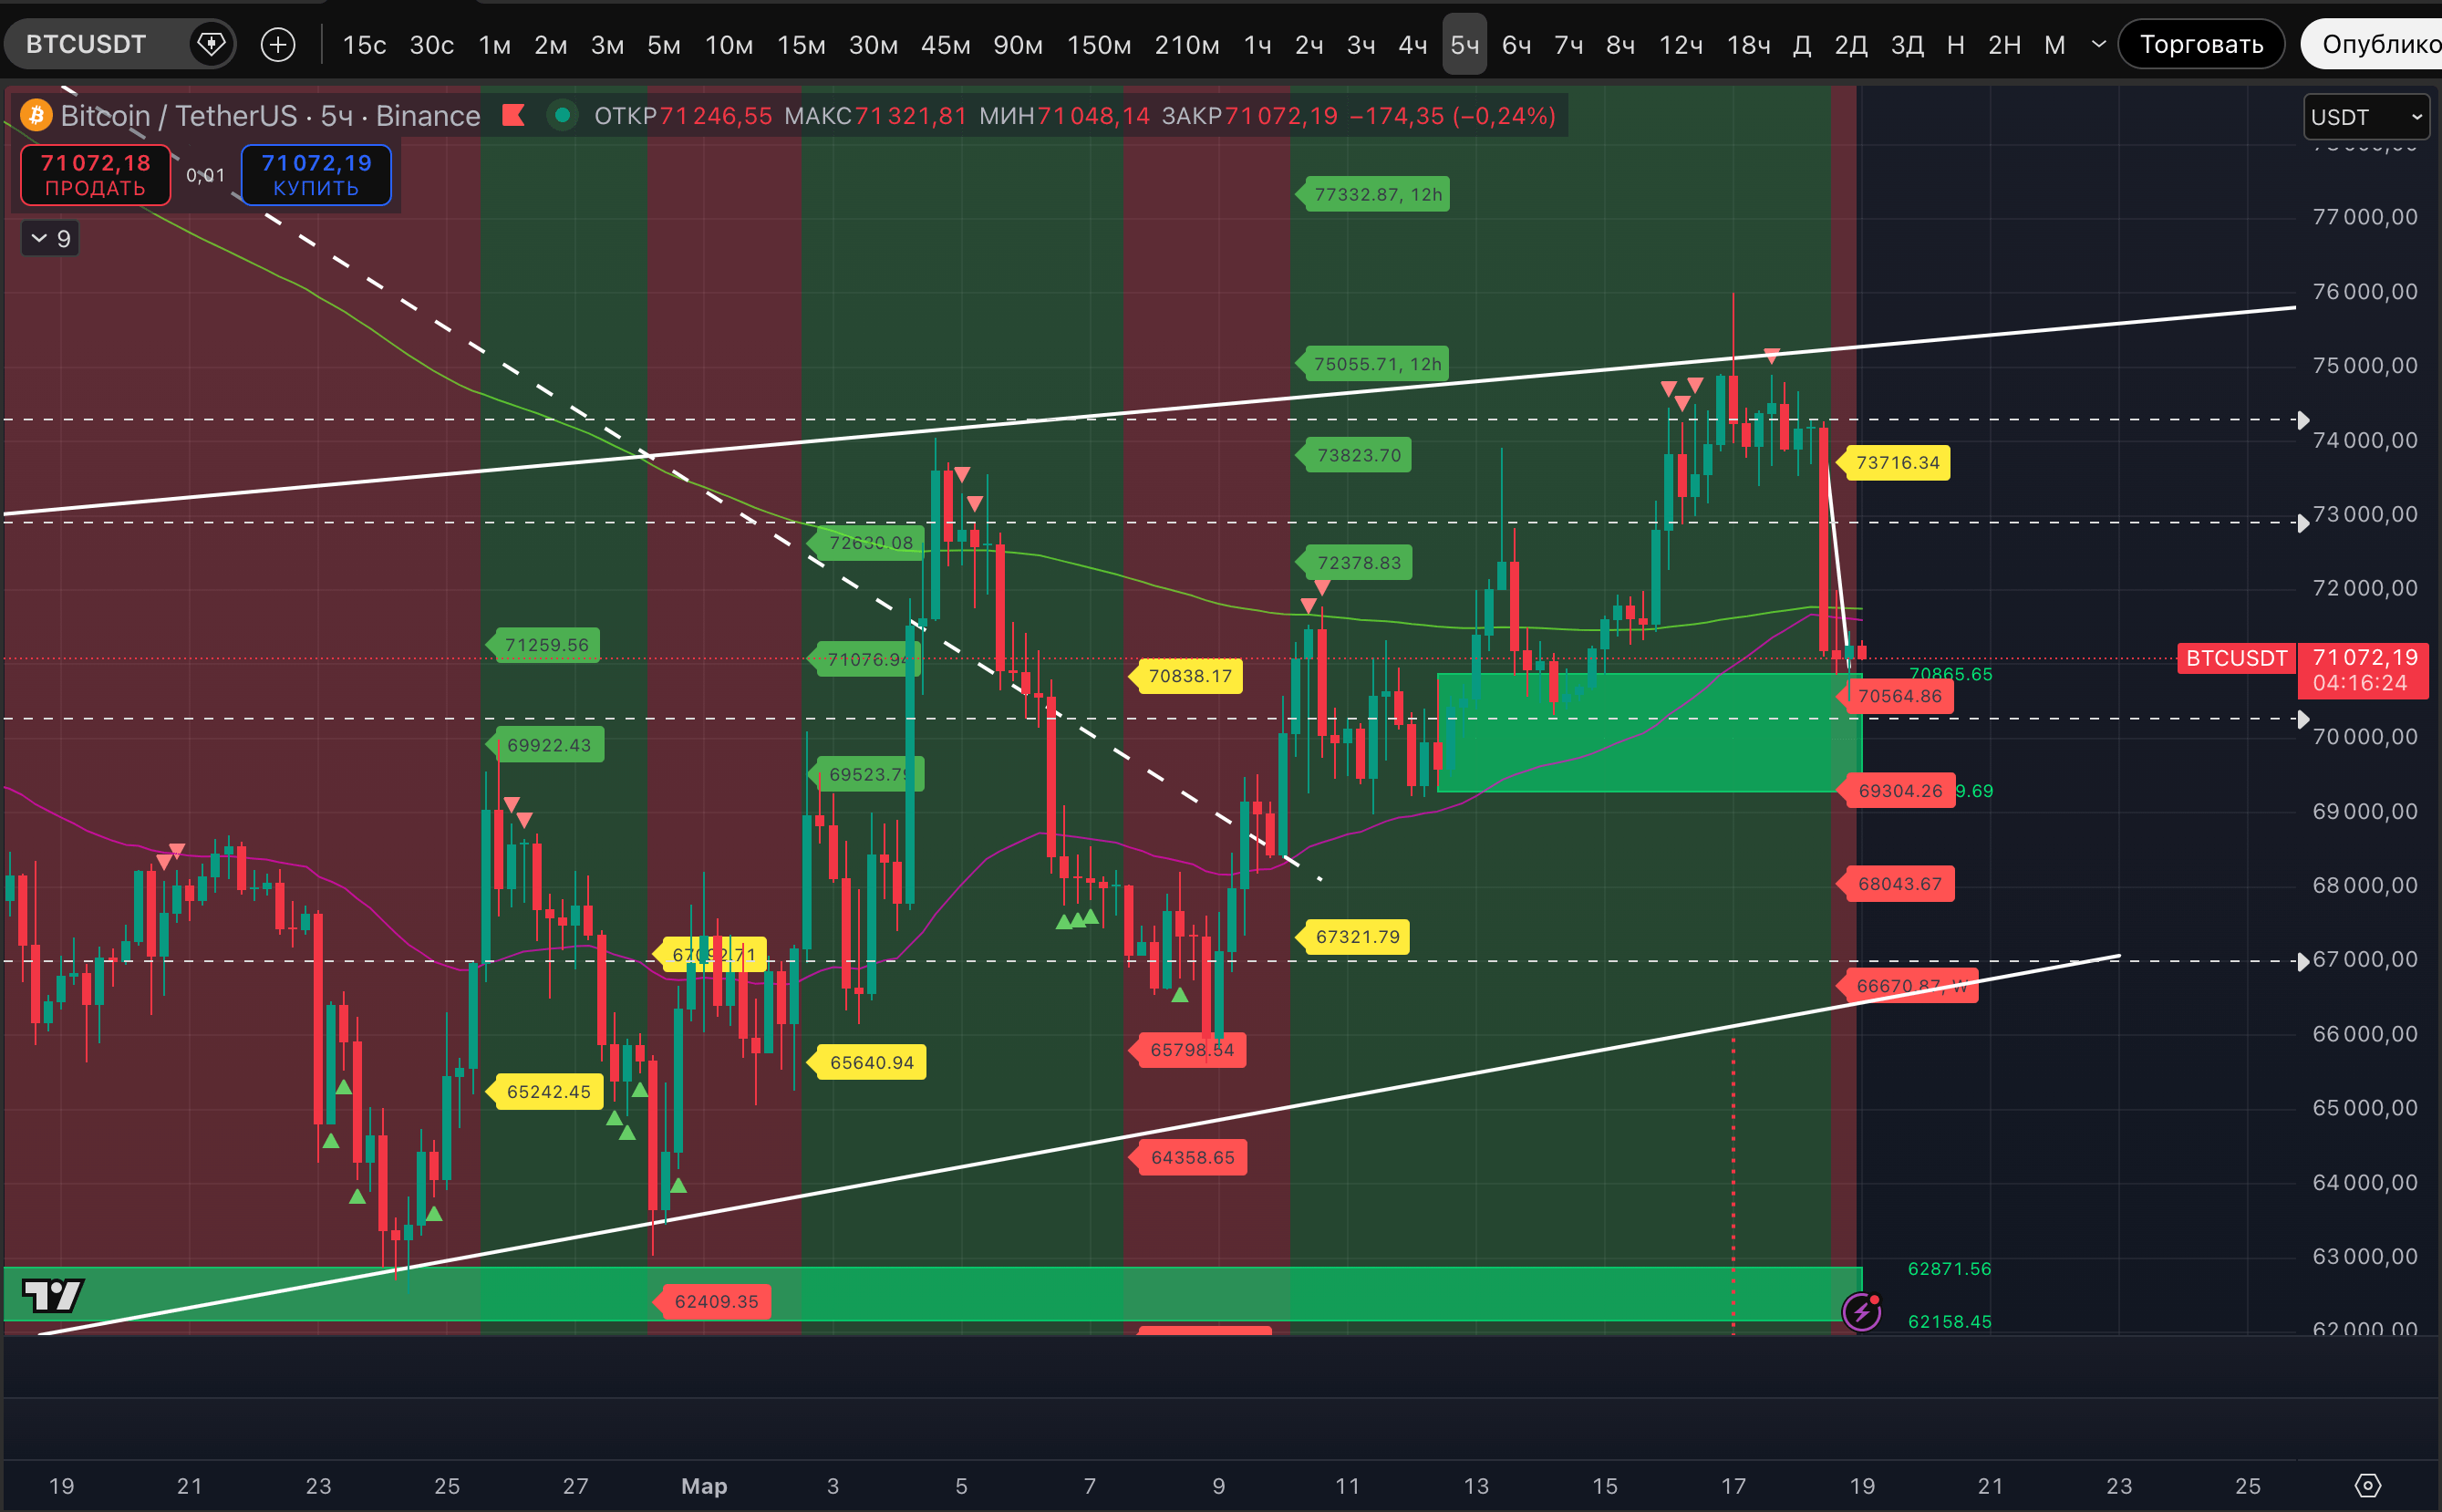
According to the stable trends of BTC after the US Federal Reserve's decision on the rate and Powell's speech, it transitioned into a stable downtrend on the 5-hour TF. The base targets that have not yet been executed: $69,304, $68,043. The potential breakdown level: $73,716. Hinting that whether with a bounce or not - the price is looking down.