
For BTC, the most unpleasant signal for bulls right now is the label of a potential high on the 3-day timeframe.
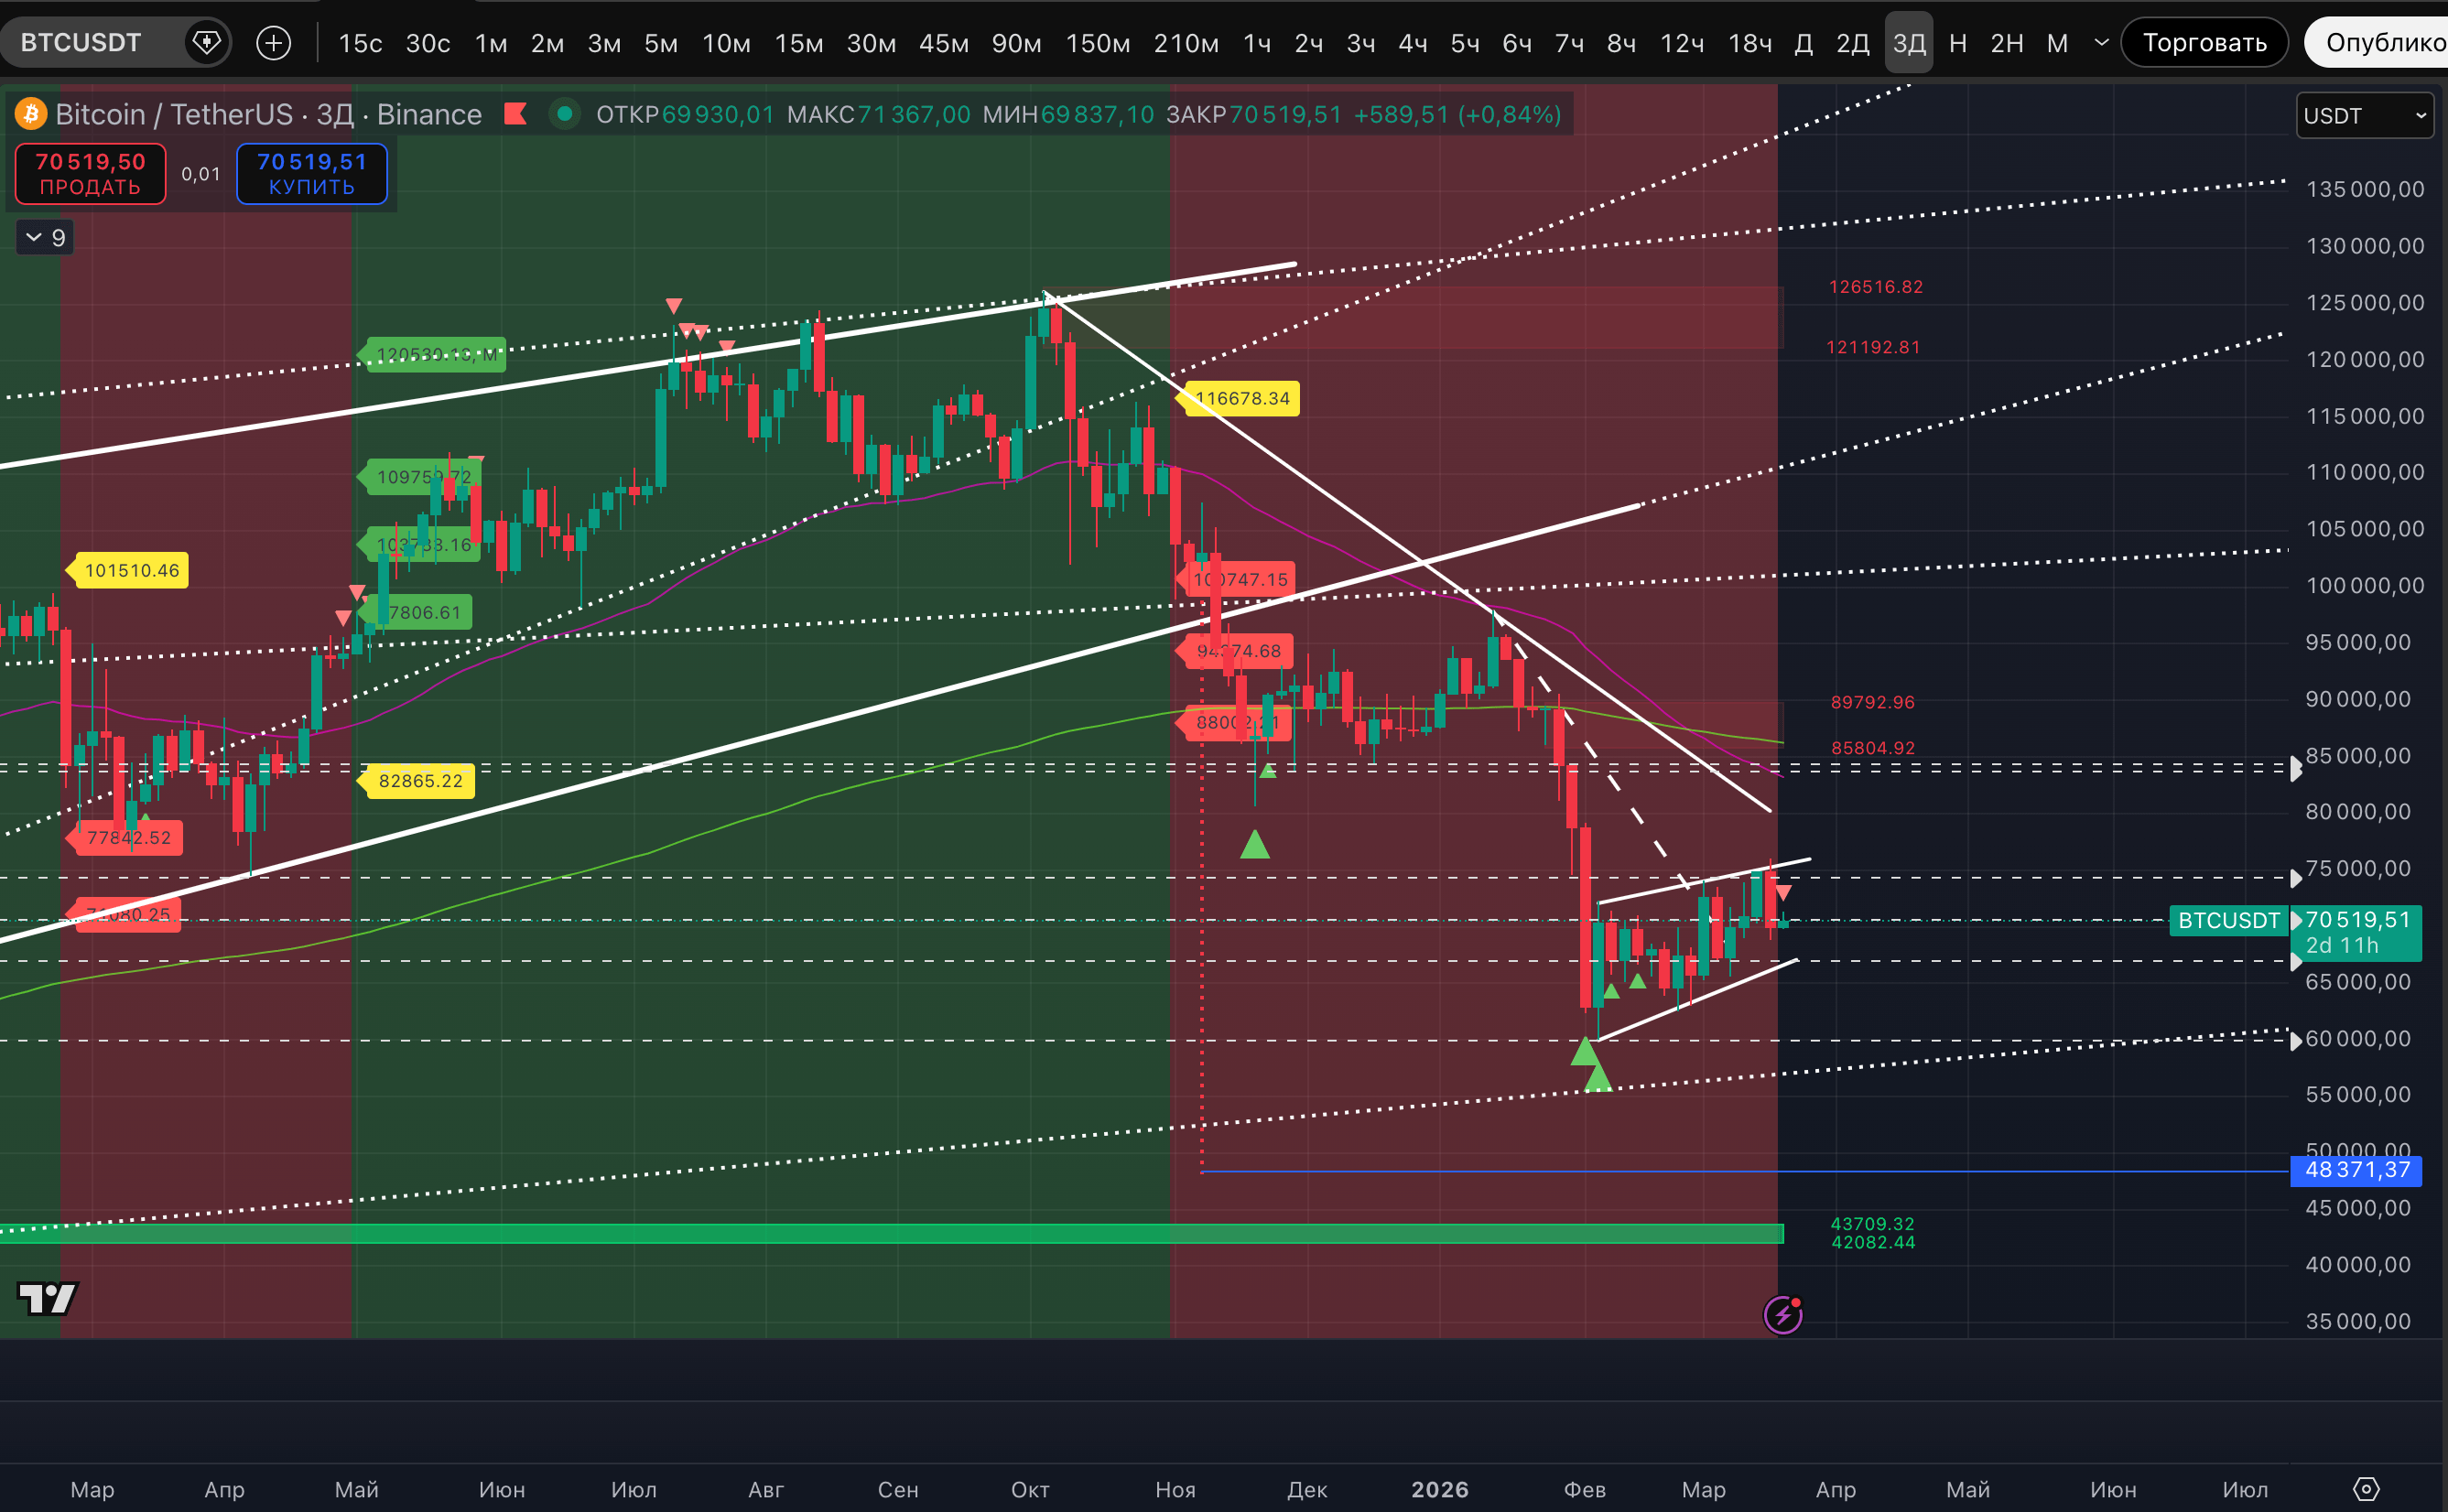
In the current decline since March 17, let us remind you that similar labels are being worked out on the daily and 2-day timeframes.
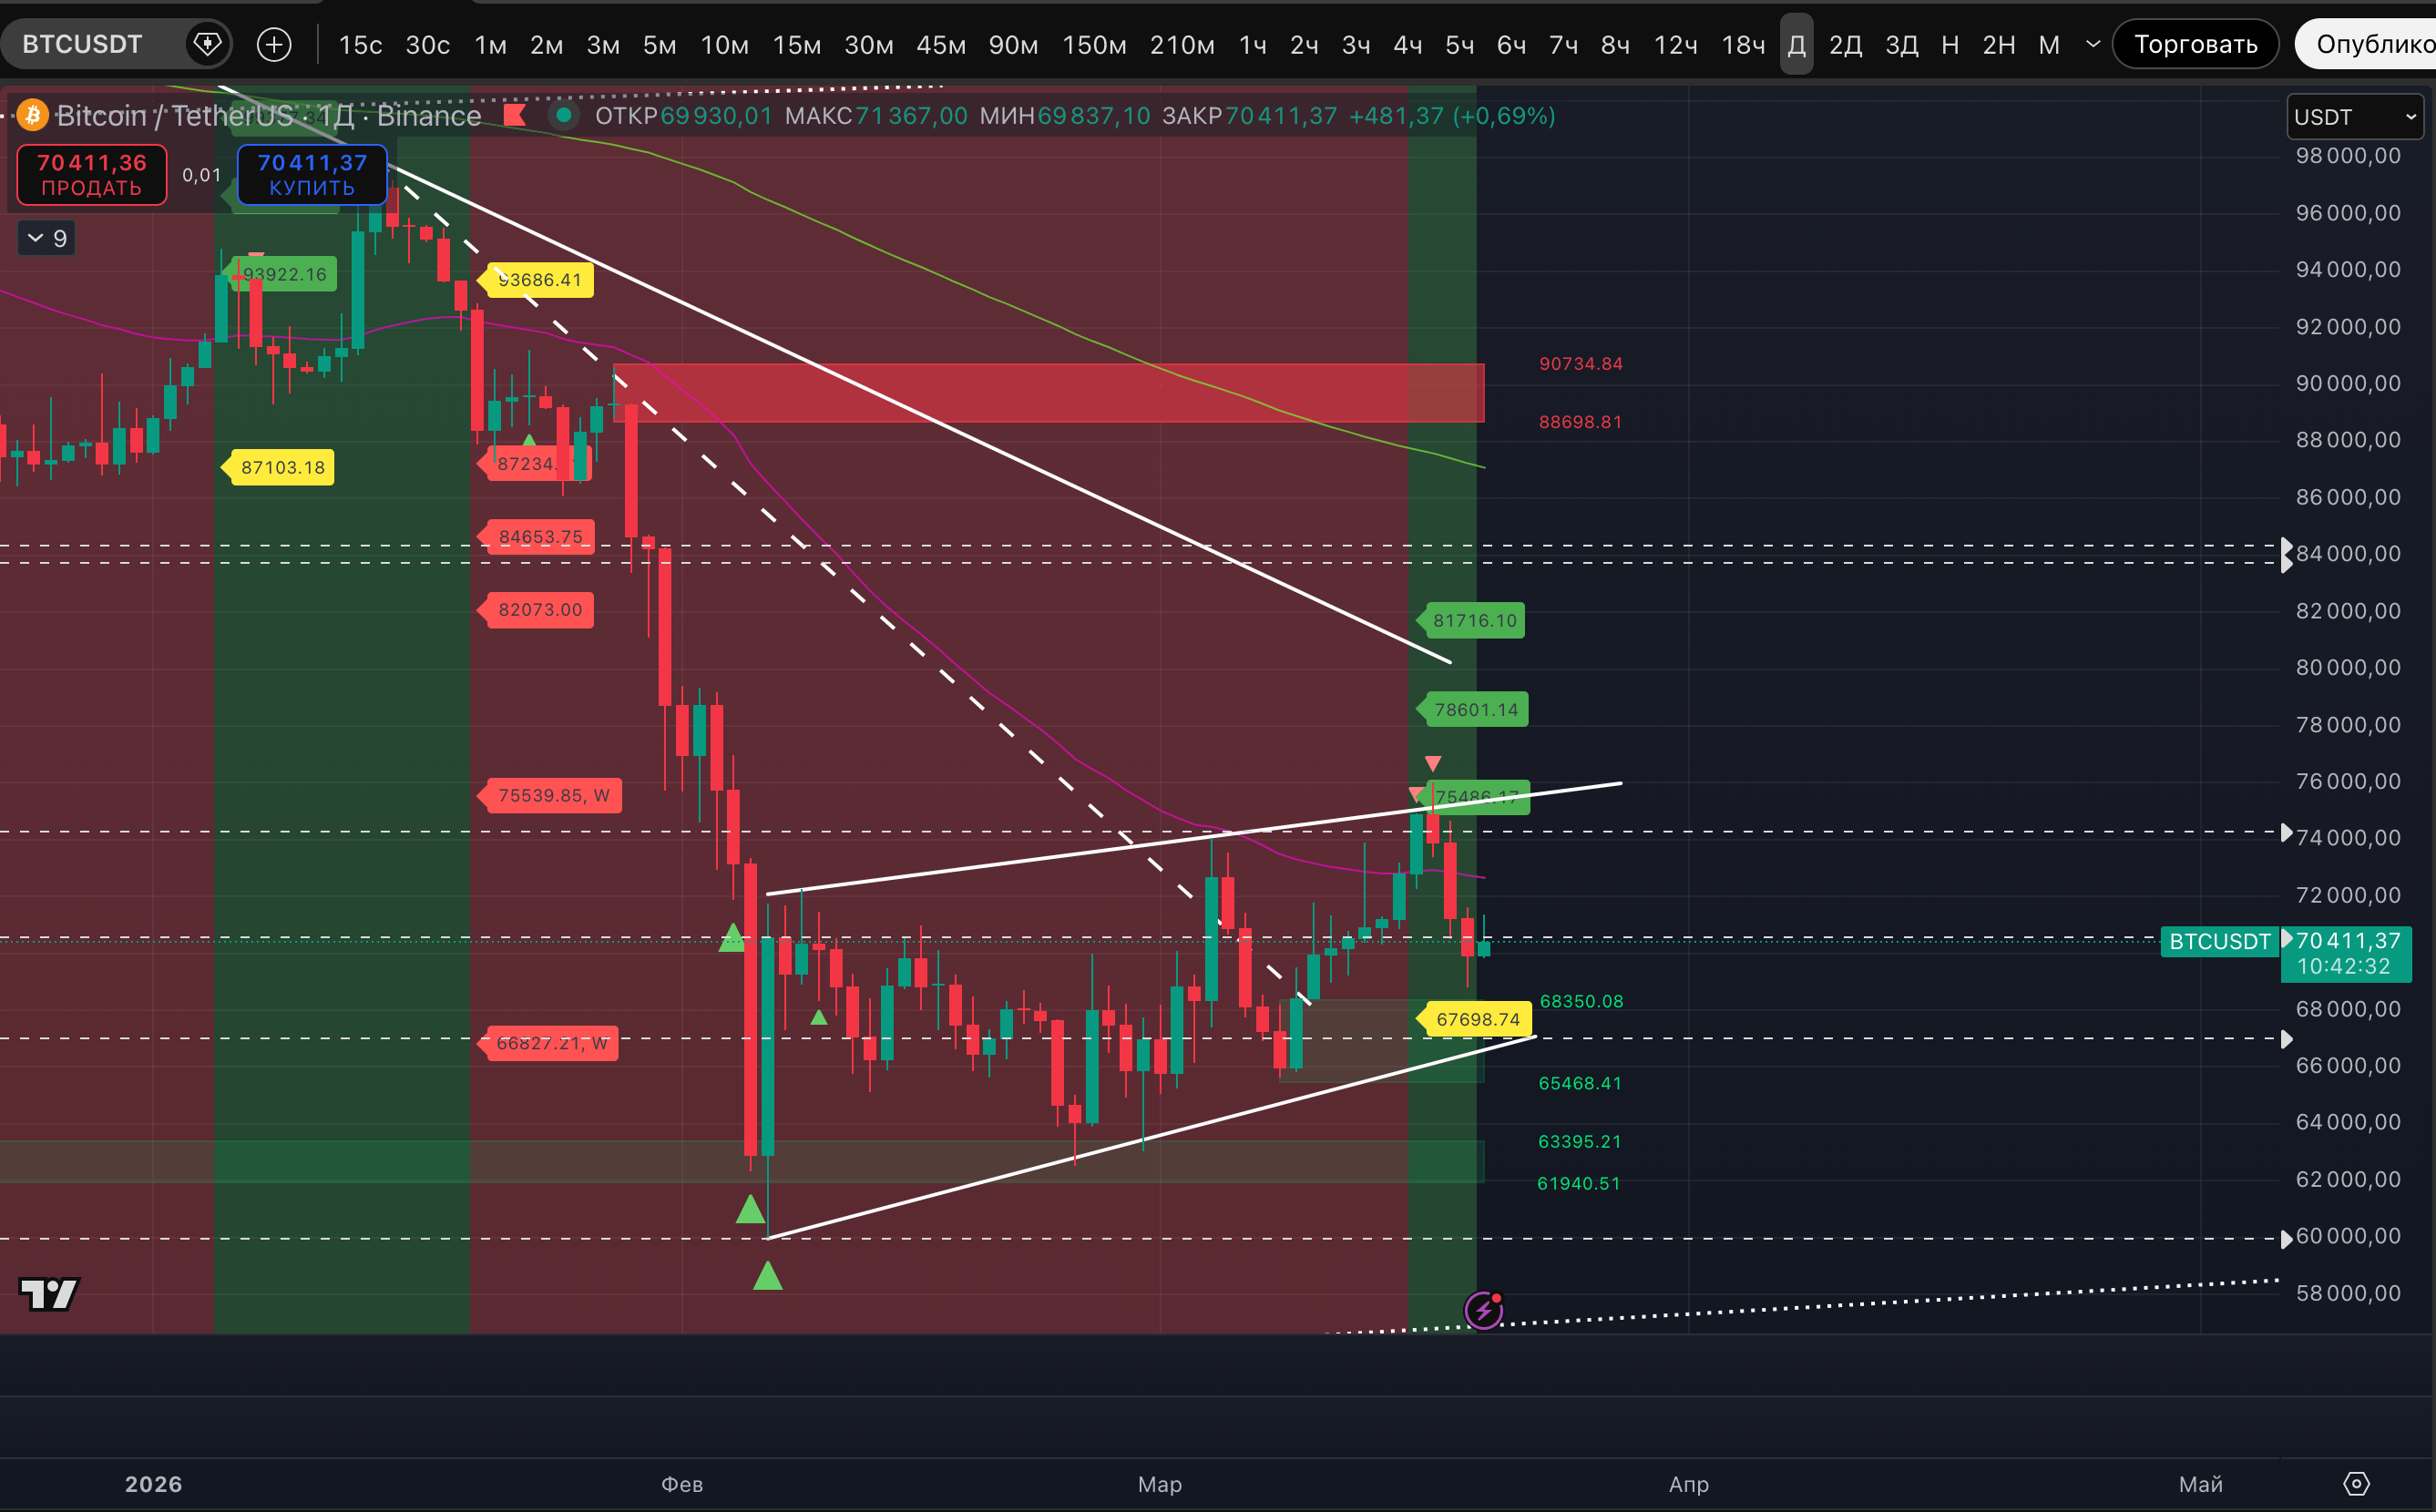
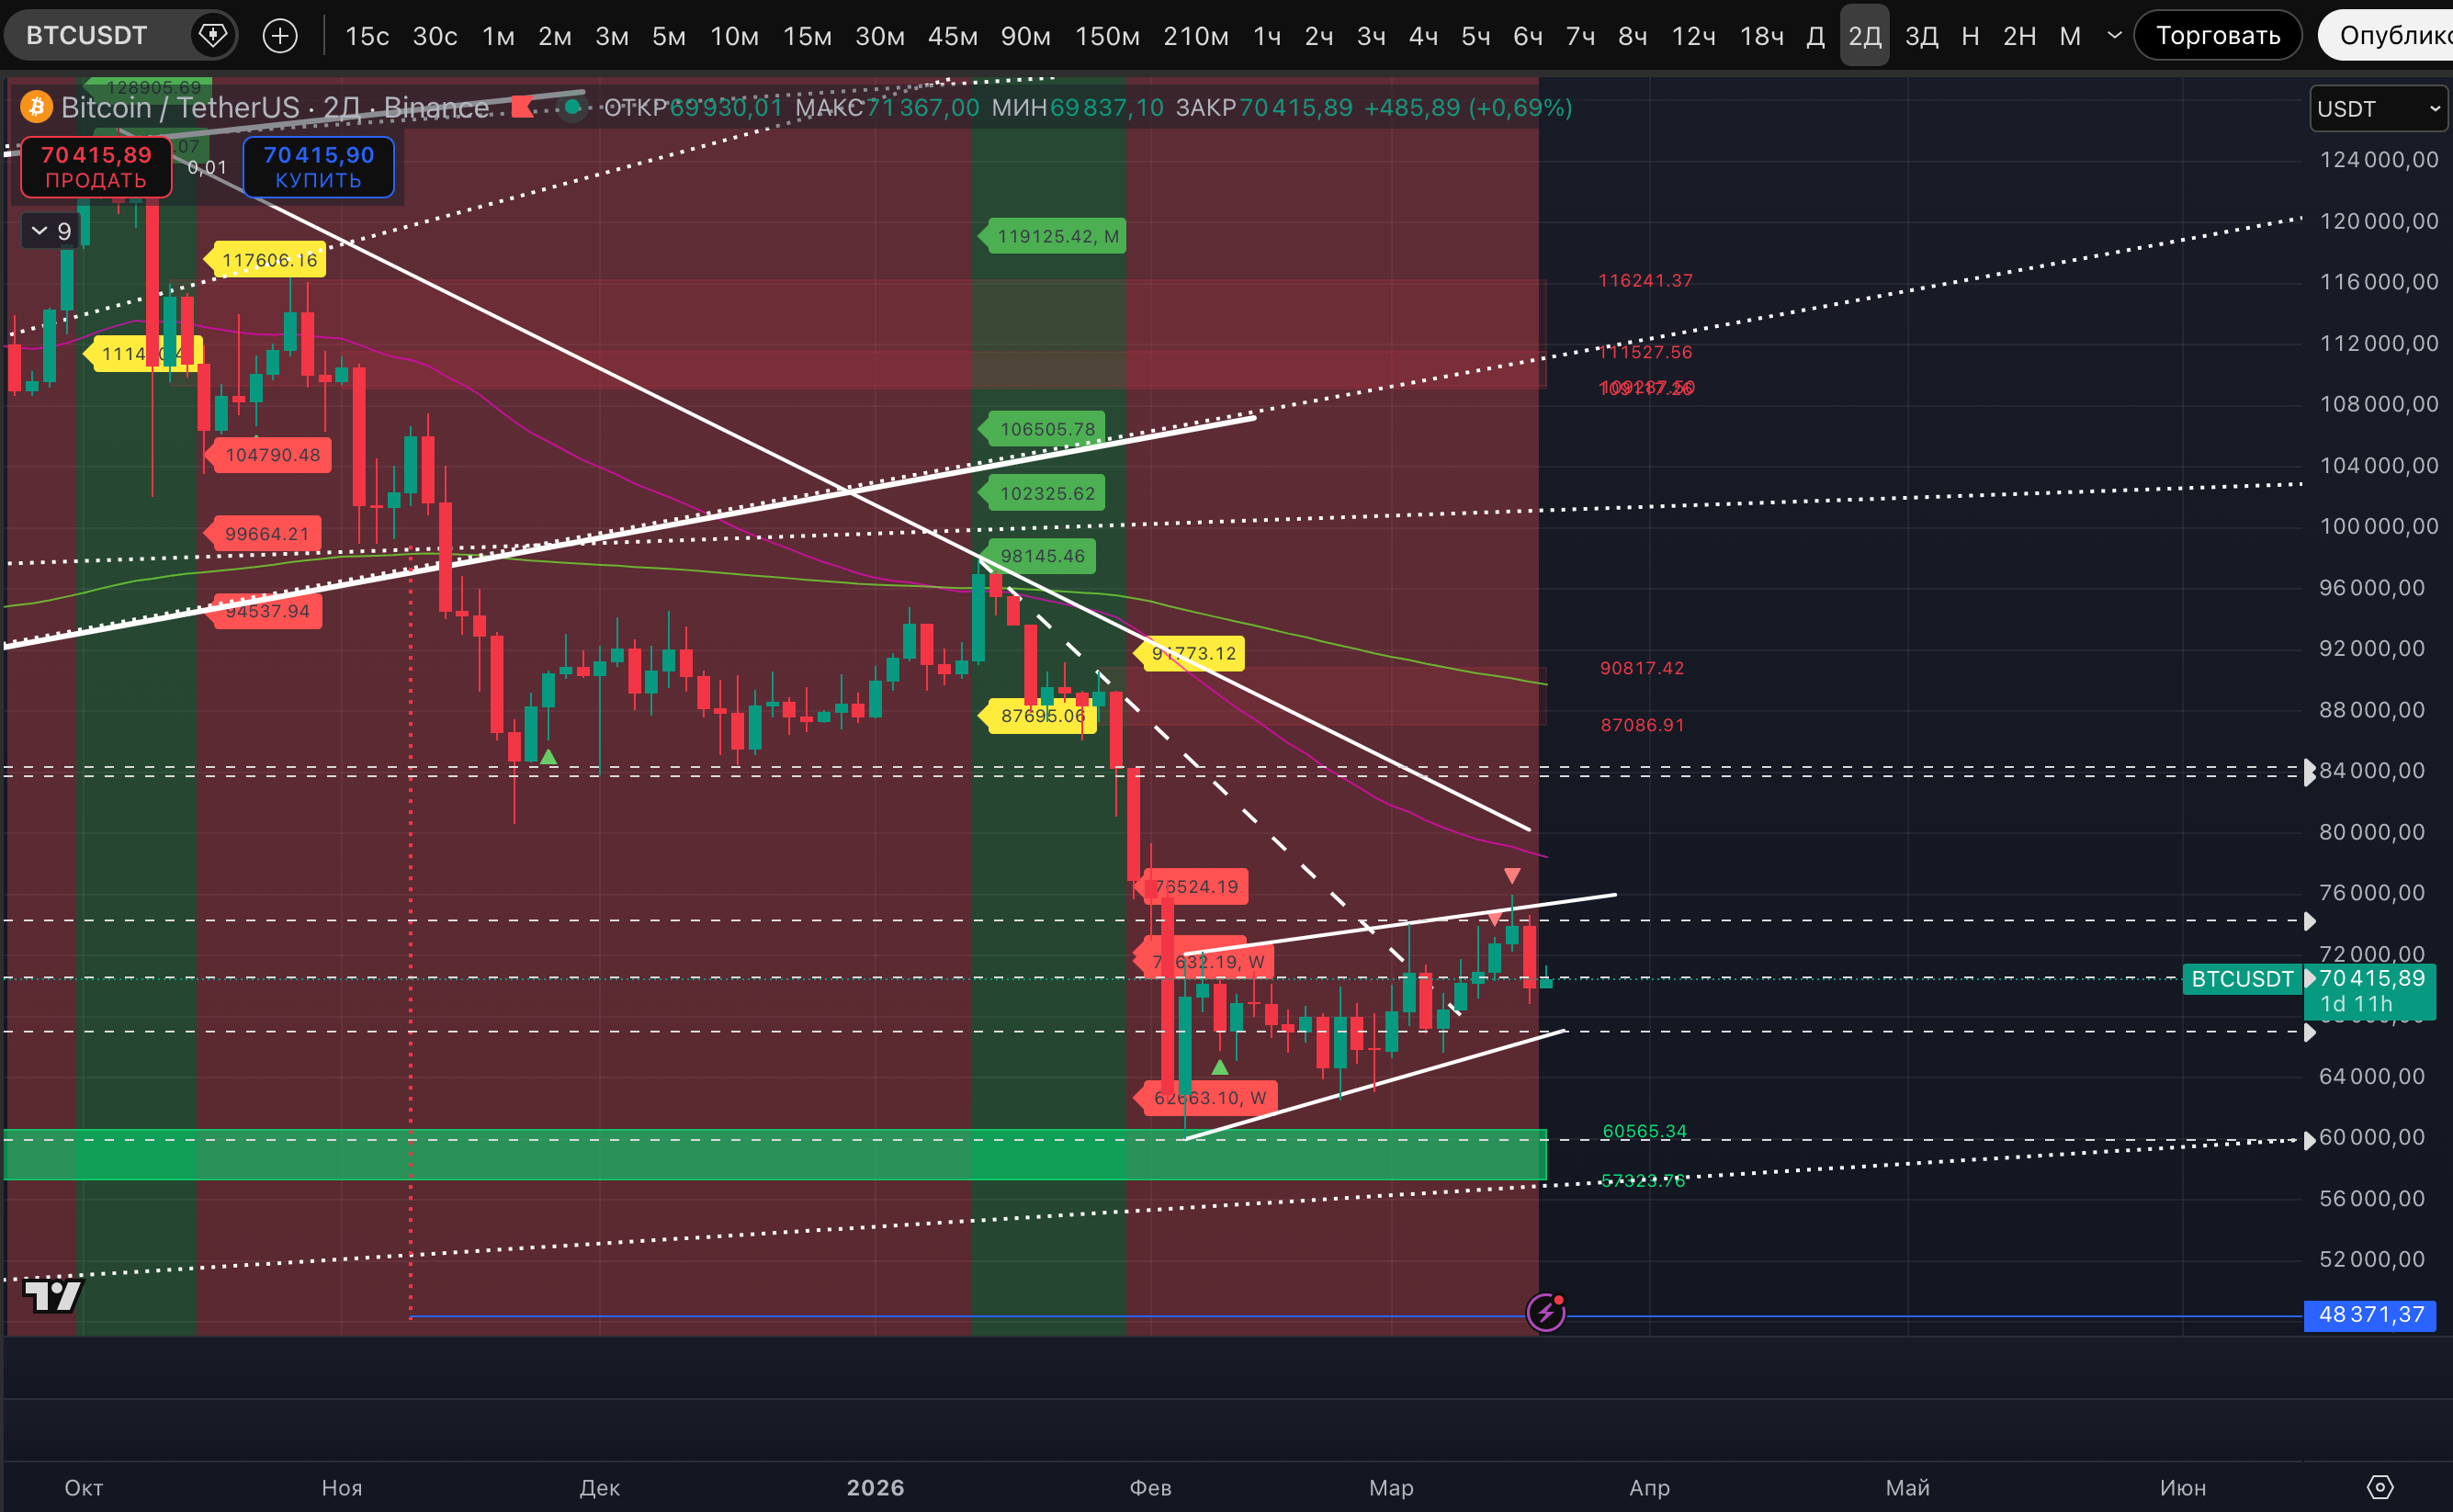
The label on the 3-day chart is now an additional factor of pressure on the price. We still remain supporters of the bullish scenario as long as a stable uptrend with targets up to $81,716 is maintained on the daily timeframe. BUT this new label is an obvious problem and a risk factor for the growth scenario.
On a more local picture since the last review yesterday, not much has changed for #BTC. Although there is a slight positive in the trends - the price has transitioned into a stable uptrend on the 30-minute timeframe.
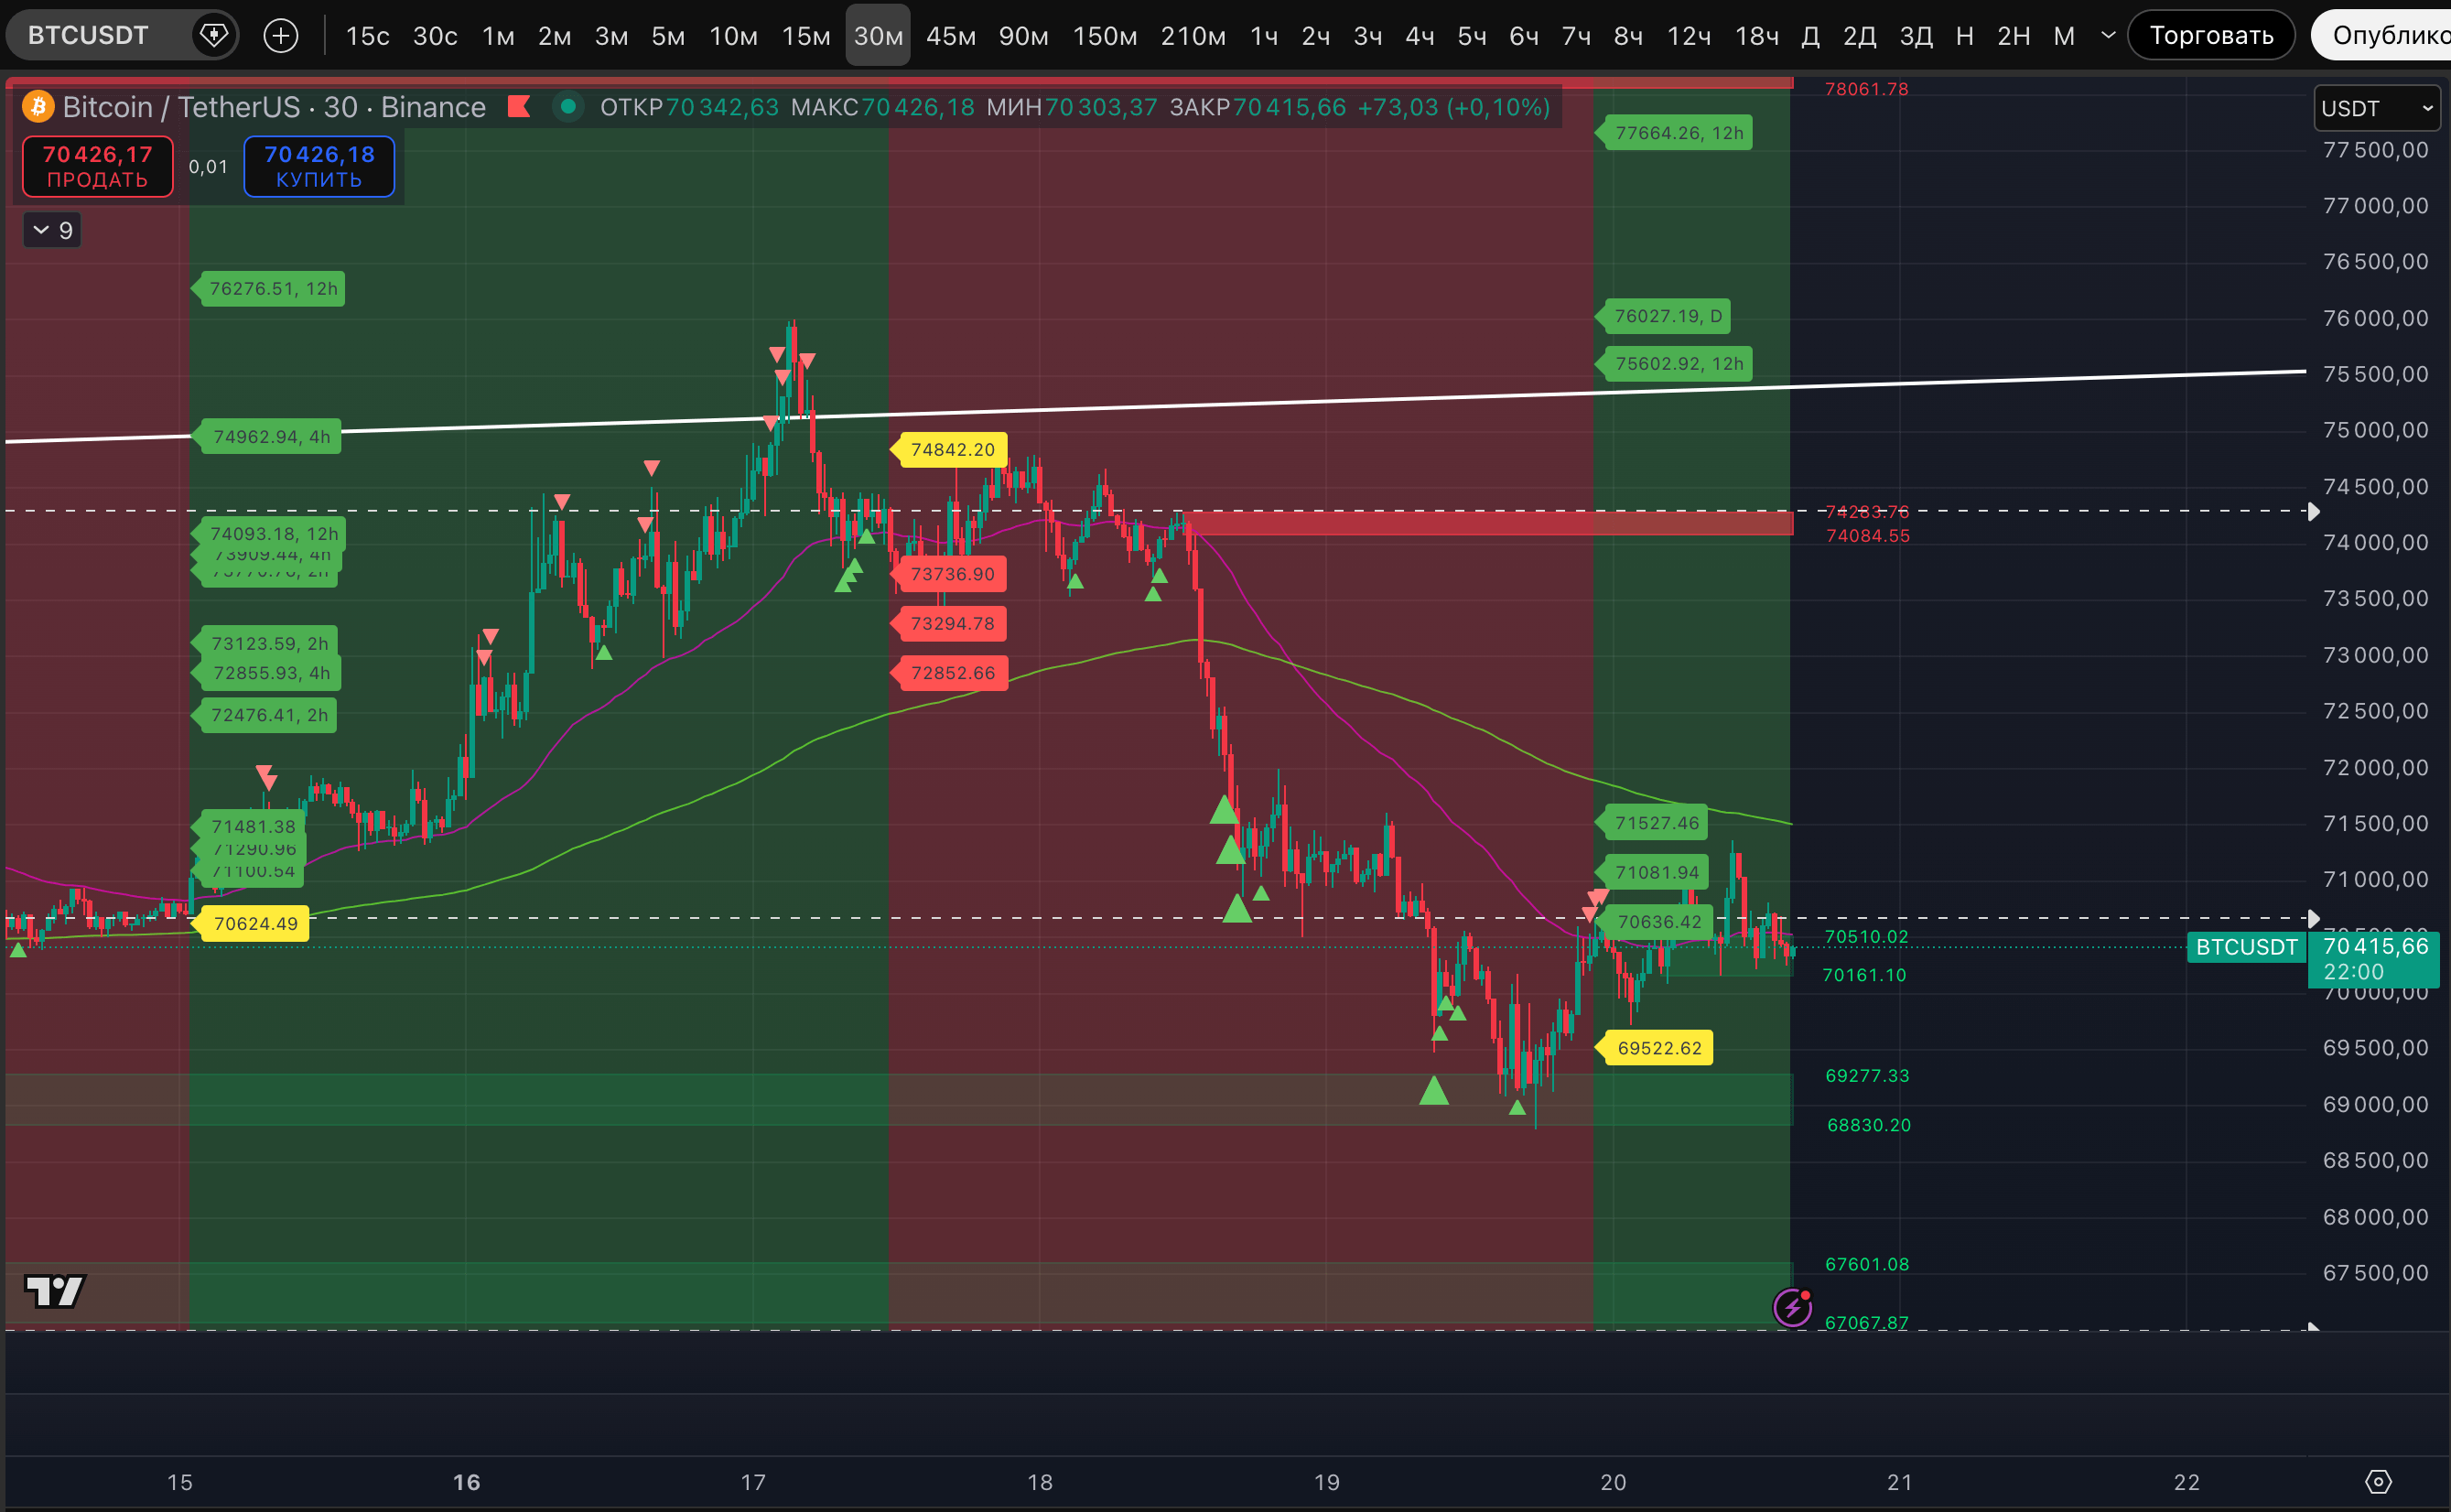
For the first time since March 17 and the area of $74,000. This means the bulls have reclaimed one achievement. And the third basic target of $71,527 was almost reached.
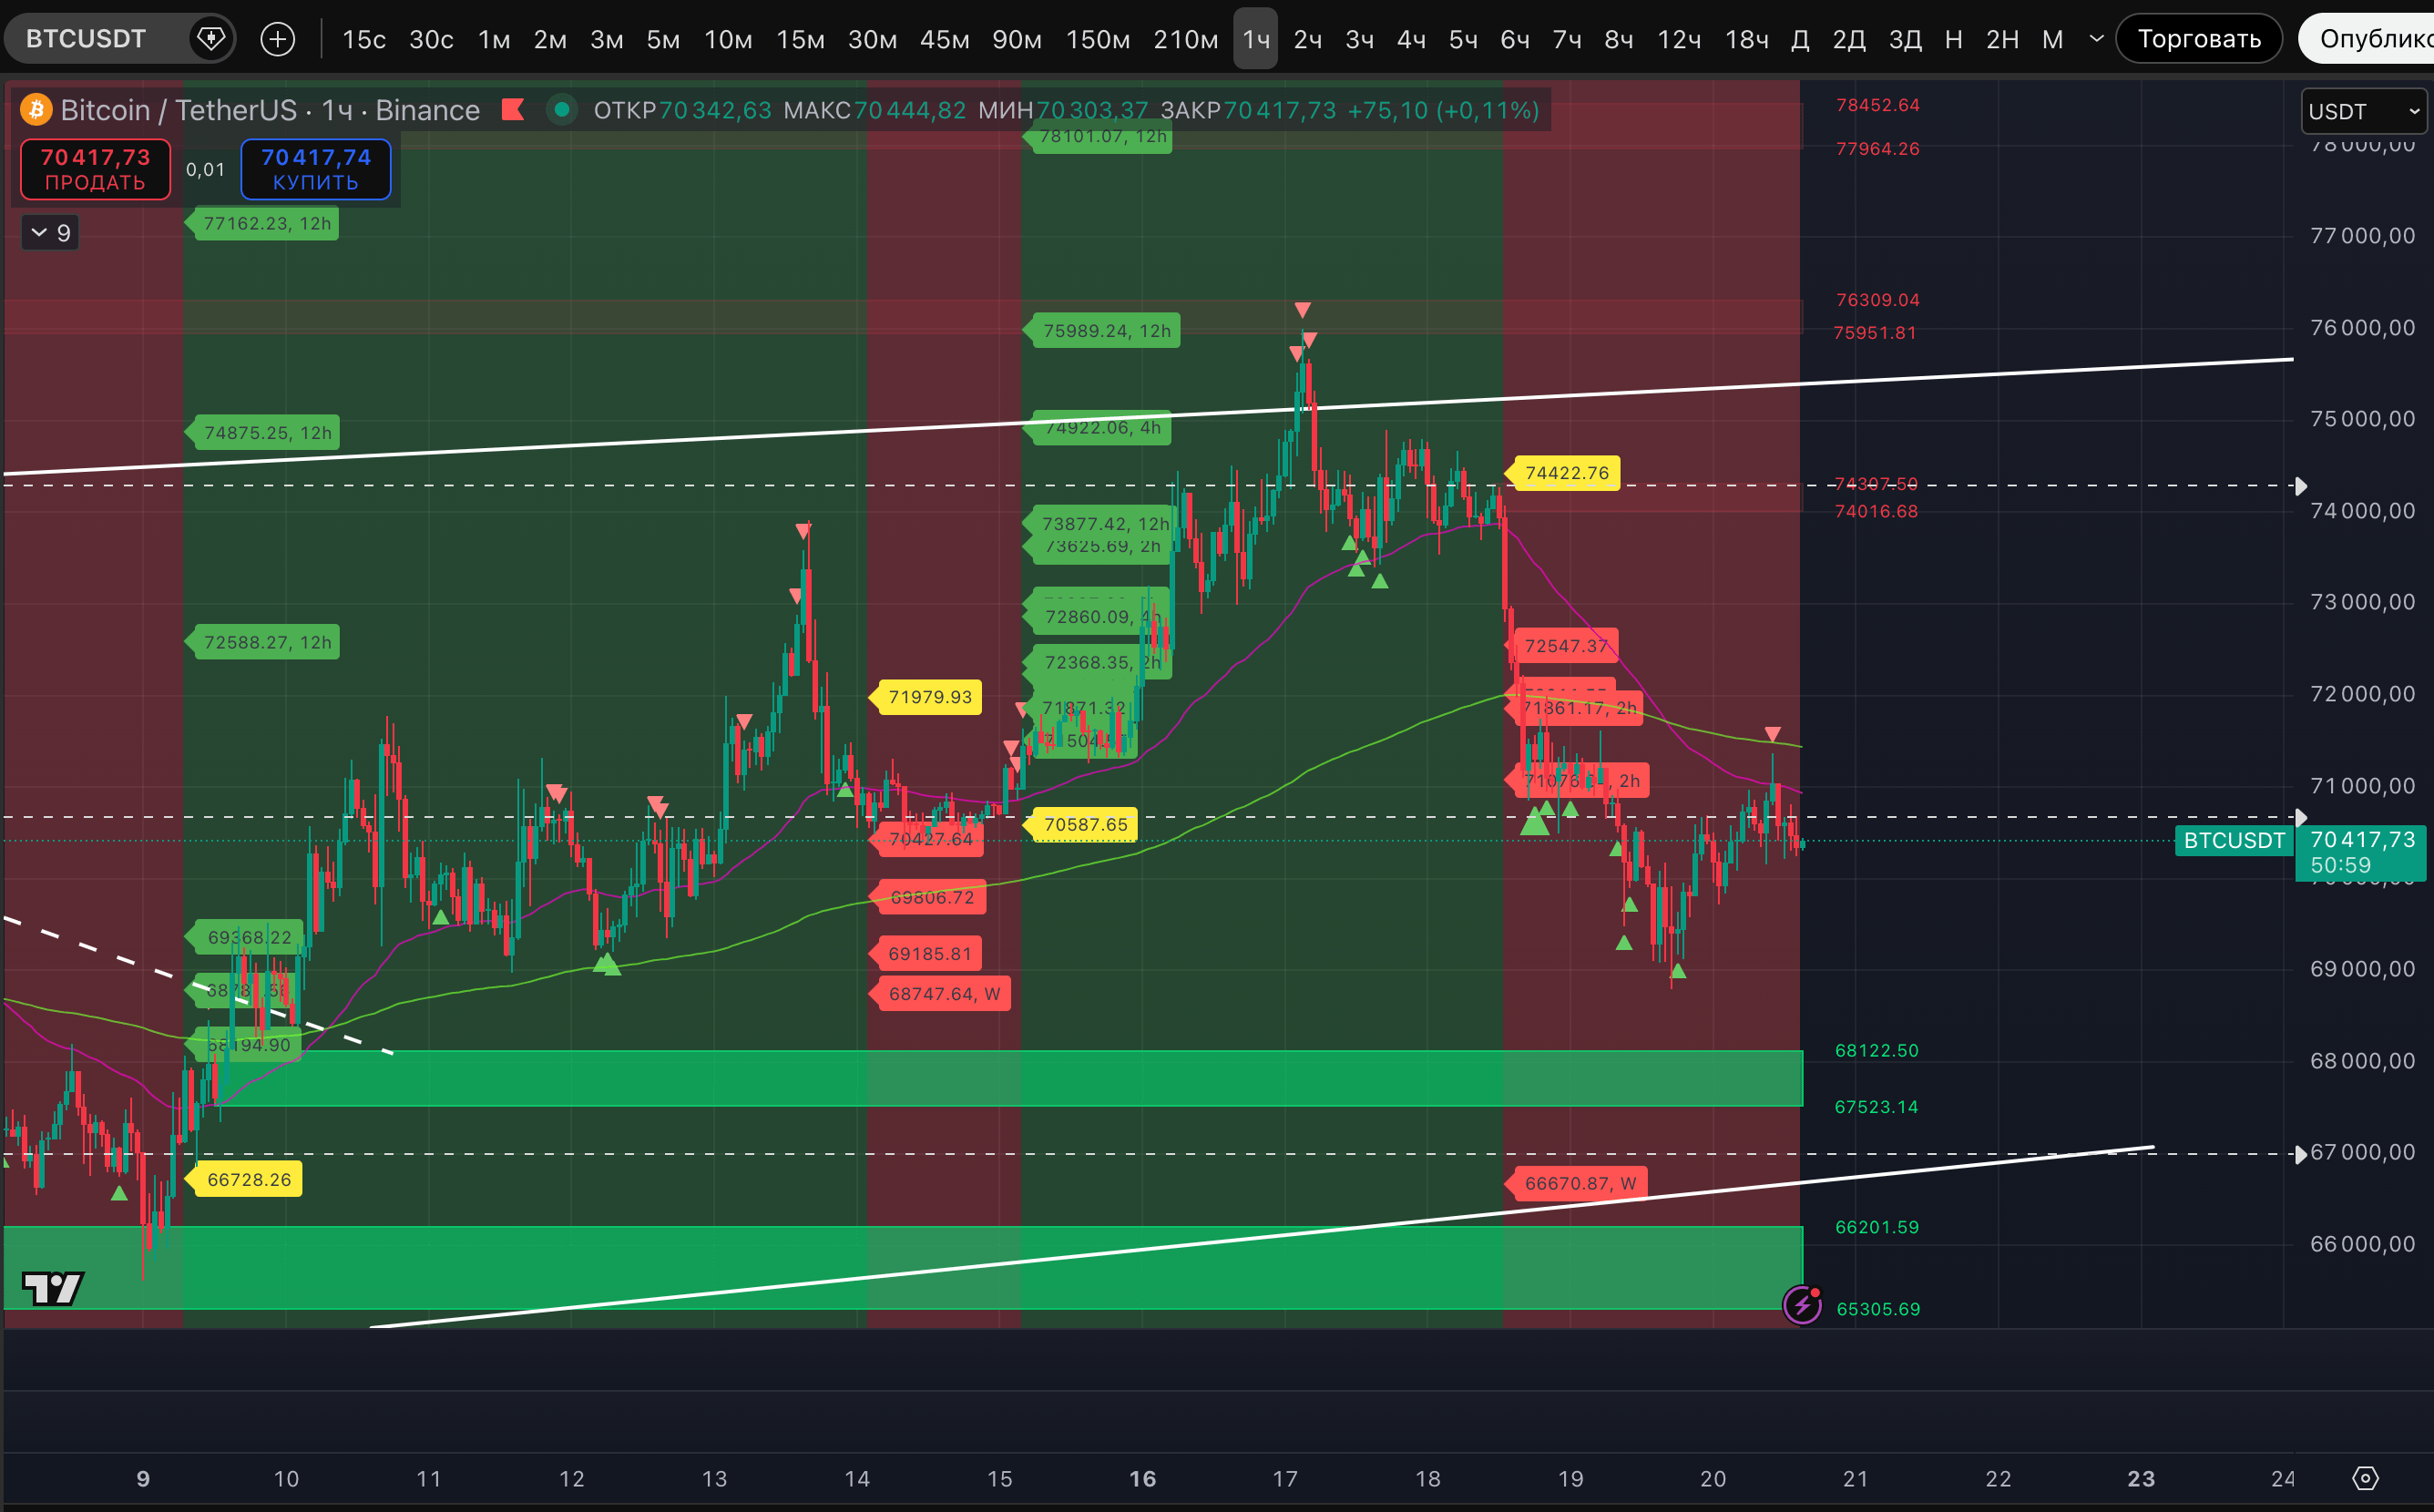
Just yesterday, it was mentioned that it was important to break above the liquidity zone of 70,634-70,936$. At the moment, this was achieved, but a correction began from the marks of a potential high on the hourly and 2-hour timeframes, which continues to this day.
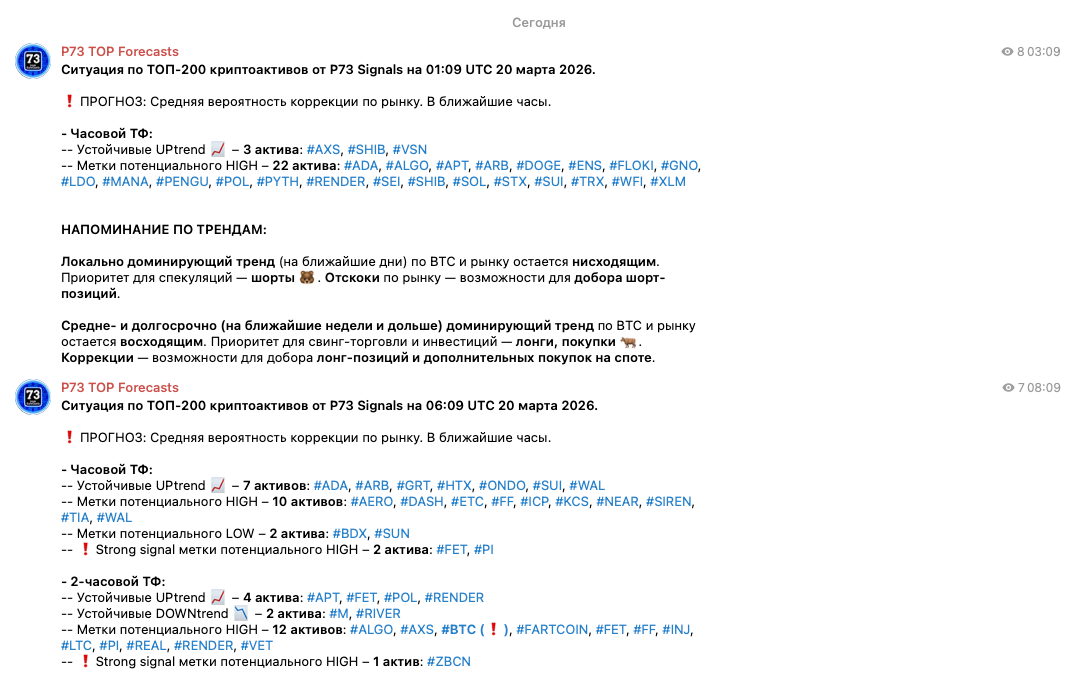
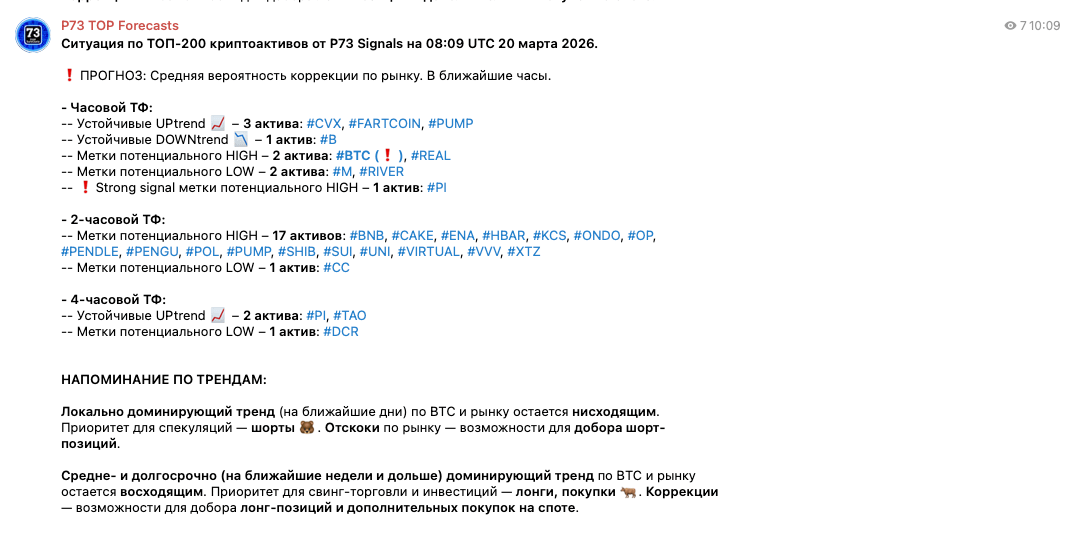
As can be seen from the screenshots, our algorithm P73 CryptoMarket Monitor warned its subscribers about this decline three times during the night and morning.
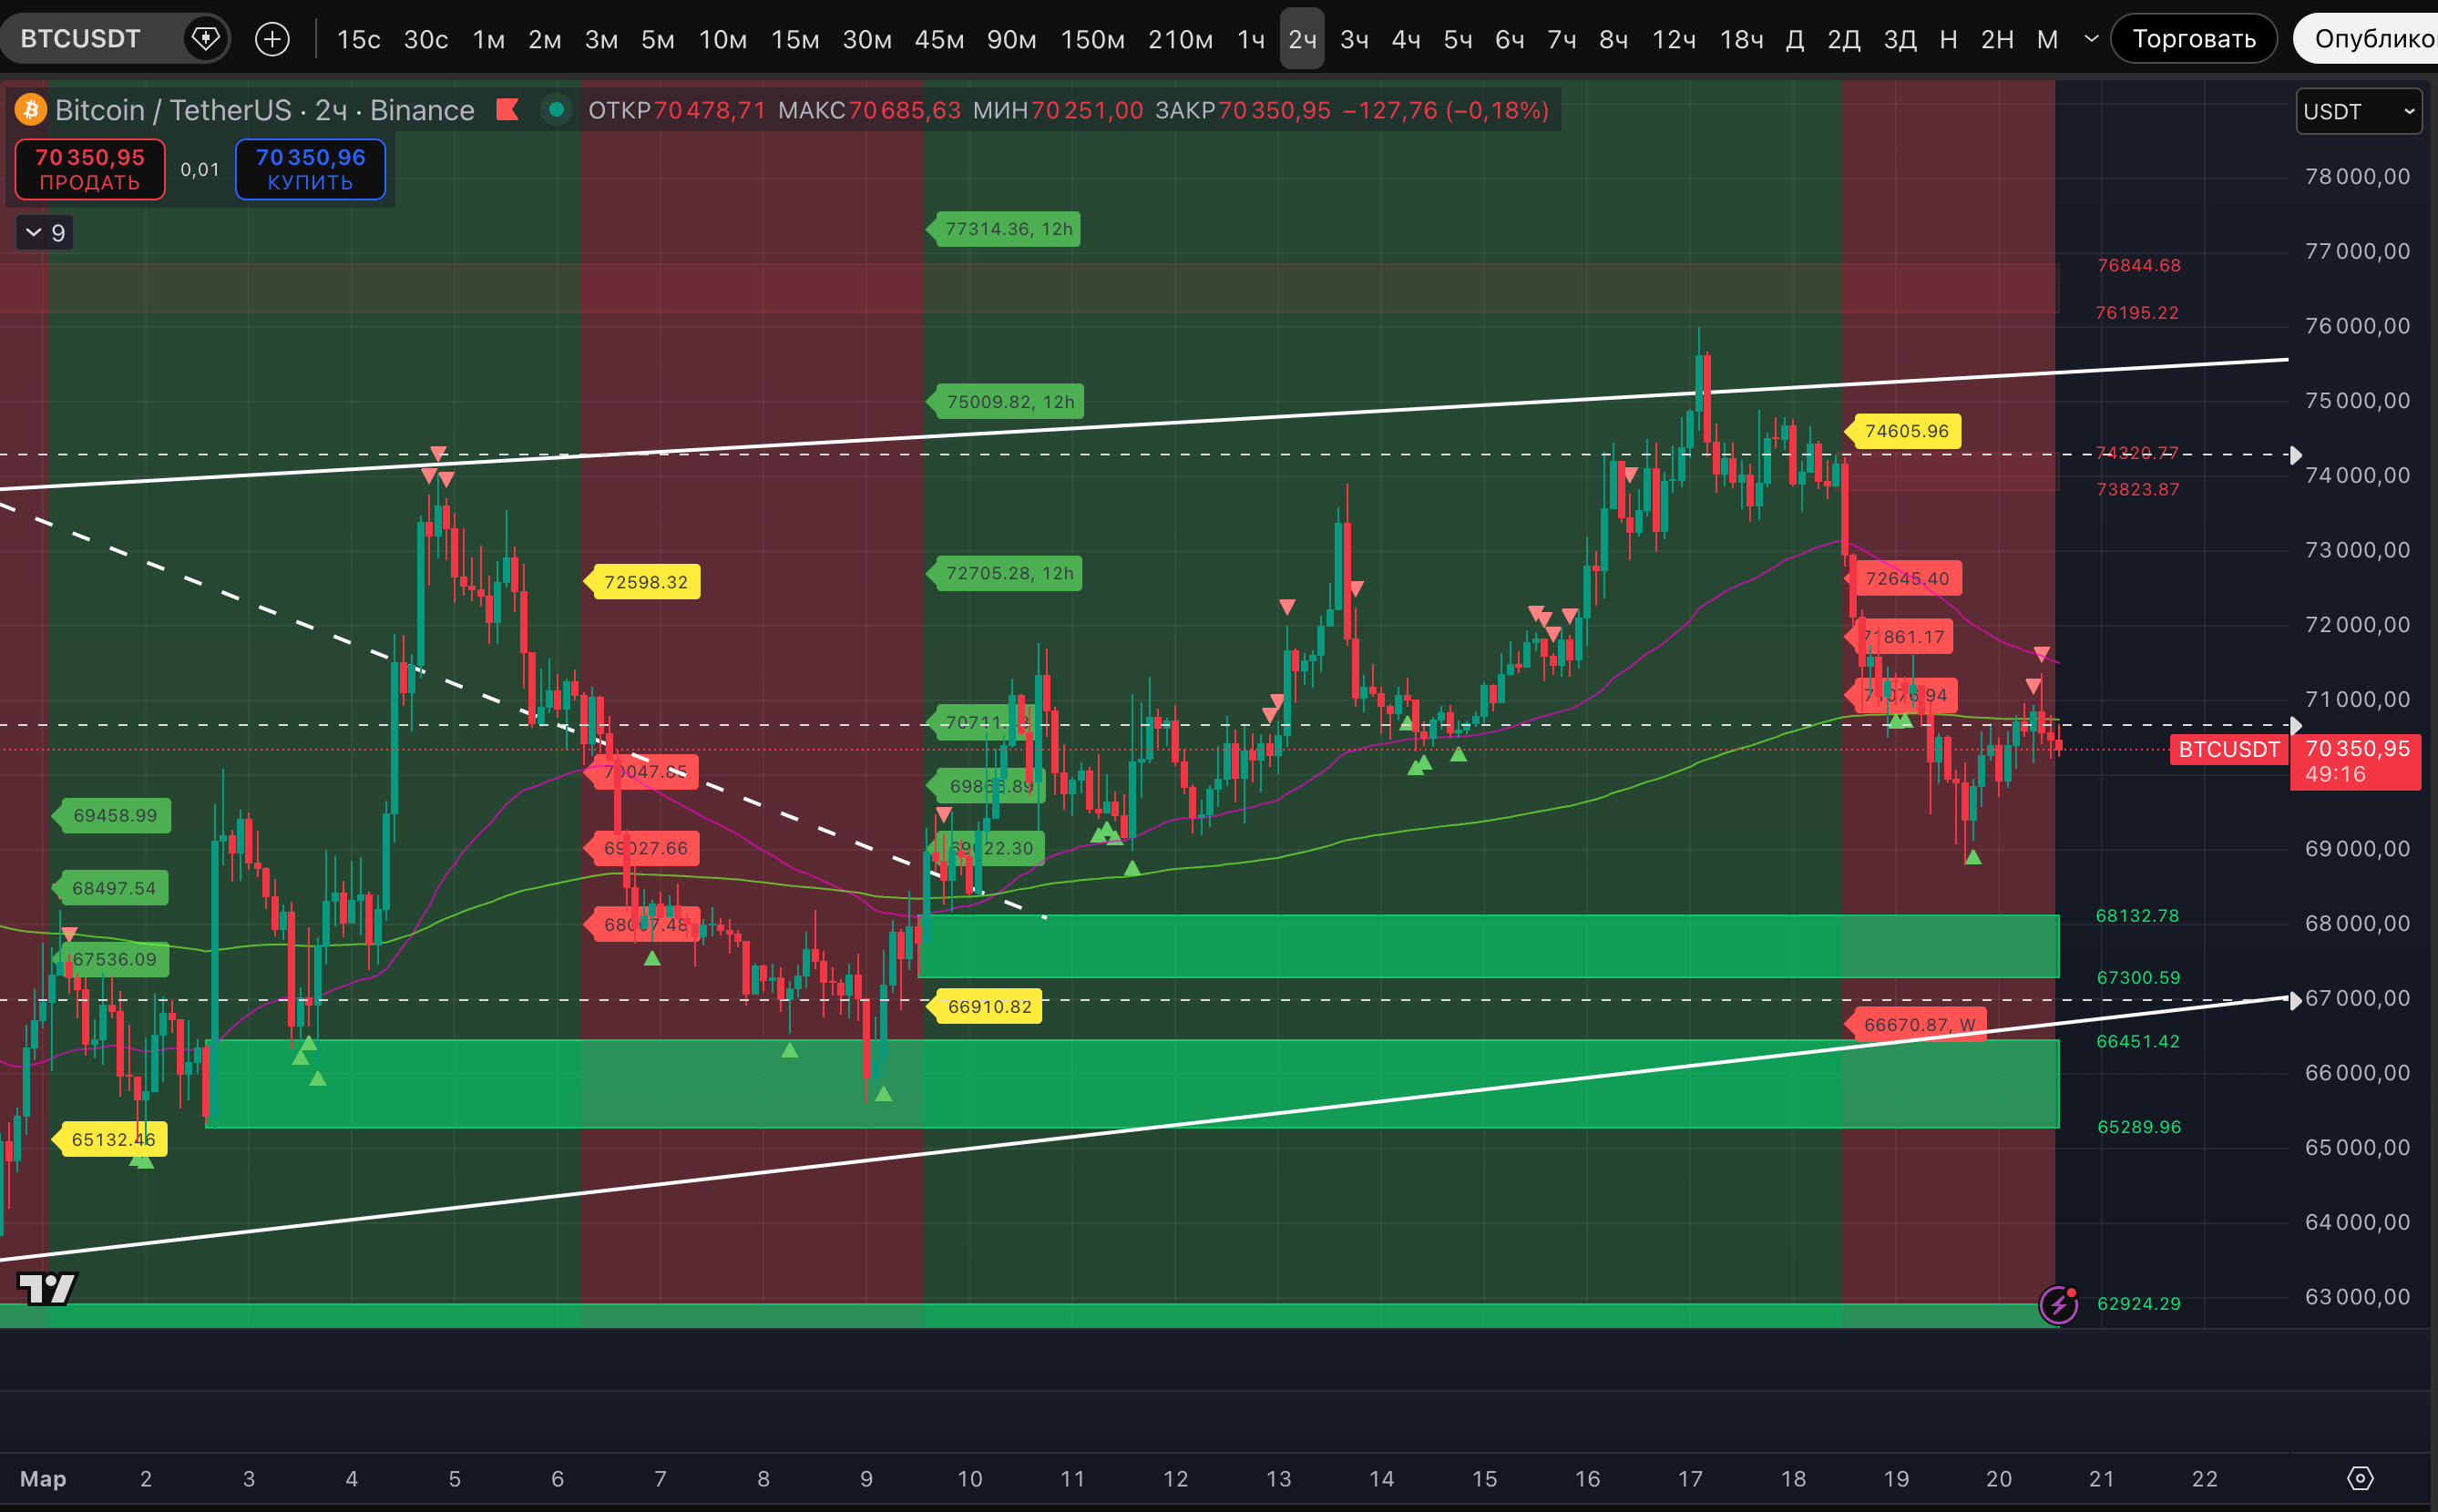
As a result of the recent bounce, the zone of 70,634-70,936$ on the hourly timeframe is currently invalidated as resistance, but this did not help continue the anticipated growth. Now, among the nearest liquidity zones that hold the price, there is only 70,895-71,500$ on the 3-hour timeframe.
According to horizontal levels during the movements yesterday and today, the level of $70,950 has ceased to be important, but the level of $70,452 remains significant. This is currently the key local level that will determine where the price goes next - to $68,793 or $72,775.
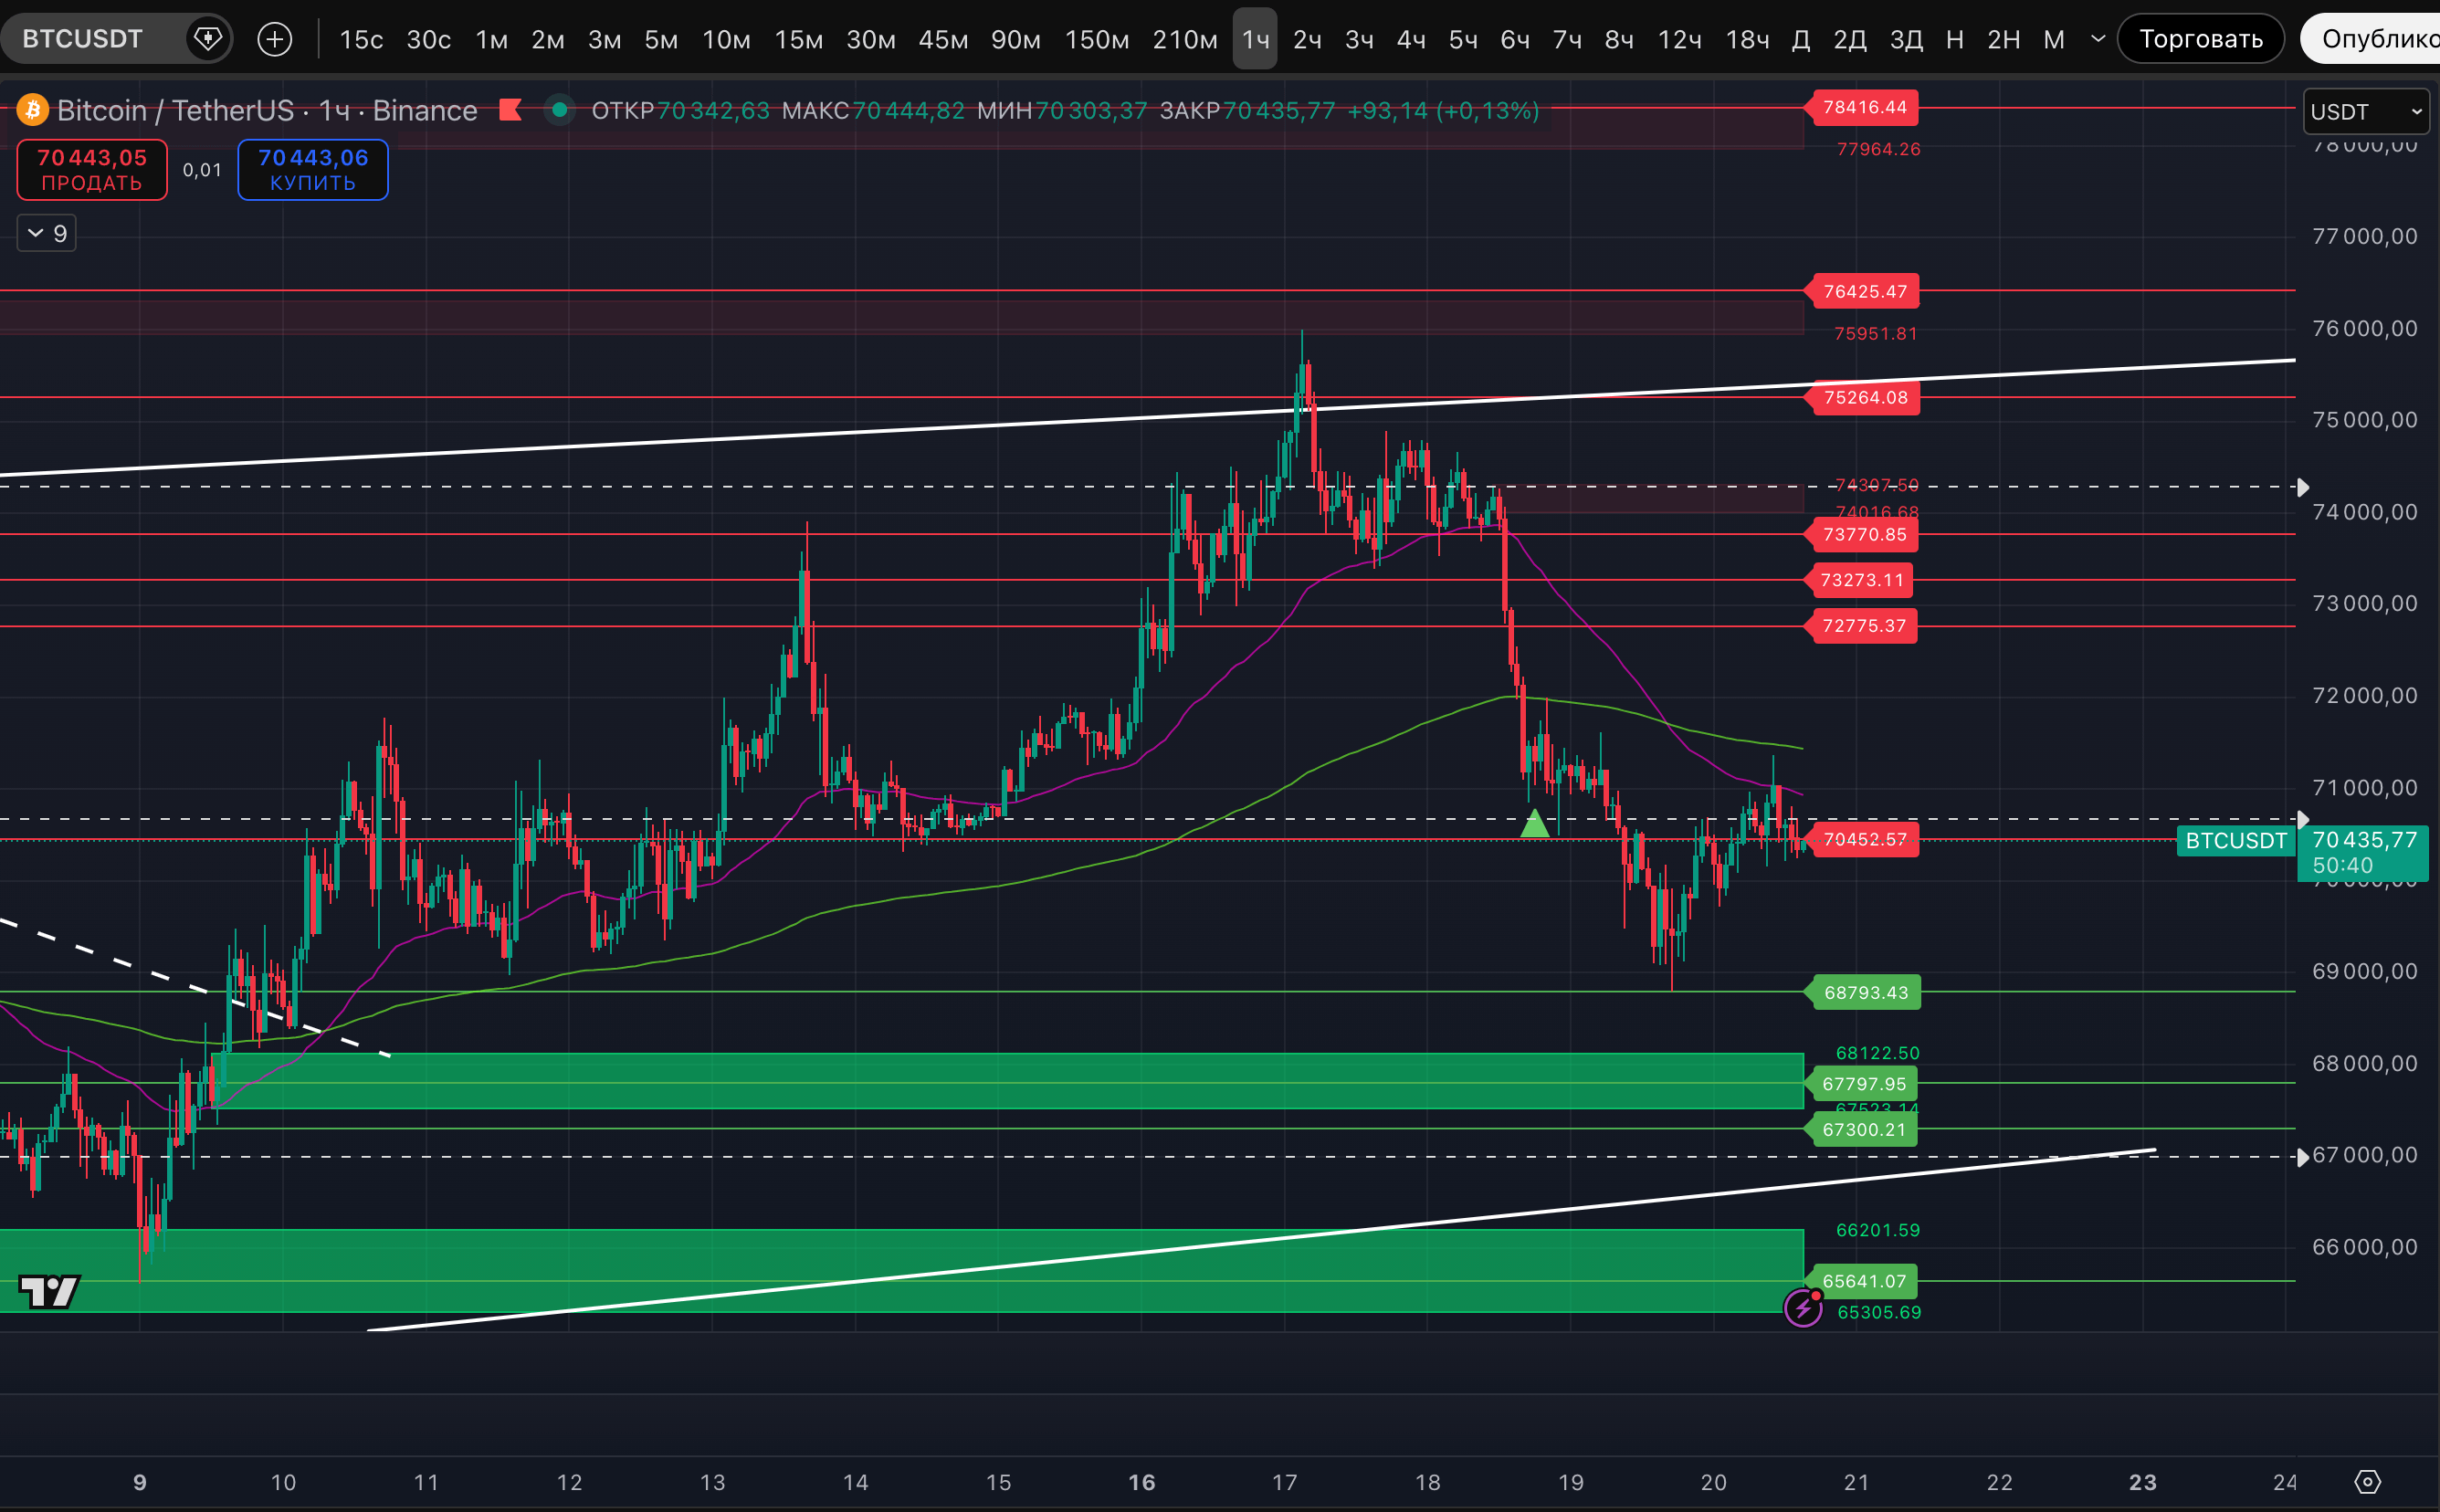
The obvious resistances now, apart from $70,452, are the moving averages. Significant ones include:
- EMA 50 hourly timeframe, currently at $70,942.
- EMA 200 2-, 3-, 4-hour timeframes, currently at $70,749, $70,578, $71,017 respectively.
- EMA 50 4-hour timeframe, currently at $71,291.
- a very important EMA 50 12-hour timeframe, currently at $70,576.
- also a very important EMA 50 daily timeframe, currently at $72,697.
At the same time, since we are talking about EMA - the EMA 200 weekly timeframe is extremely important, currently at $68,048. Since the end of January to the beginning of February, it has been literally a horizontal line. It was tested with a squeeze during a dump. Part of the time since then, the price has been below it, but last week it managed to recover above. As long as the price stays above and closes above with the body of the weekly candle - one can even assume that the asset is waiting for a substantial rise from this support.