
1. Price Overview and Technical Structure
The market has entered a phase of high volatility and defensive consolidation after failed attempts to break key resistances.
Bitcoin ($BTC ): It is trading in a critical range between $69,300 and $71,000. After testing $75,000 last week, the price shows a bearish bias in the short term. Analysts are watching the support at $66,000; a break below could lead to a capitulation towards $54,000 - $57,000.
Ethereum ($ETH ): It maintains a close correlation, operating near $2,150. Strong resistance is observed at the EMA200 (approx. $2,900). As long as it does not reclaim that level, the risk of retesting lows close to $1,200 - $1,500 remains.
Altcoins: Performance is mixed. Projects like TRX have shown resilience, while other sectors like meme coins (e.g. $PEPE ) and infrastructure protocols face corrections after February's deleveraging.
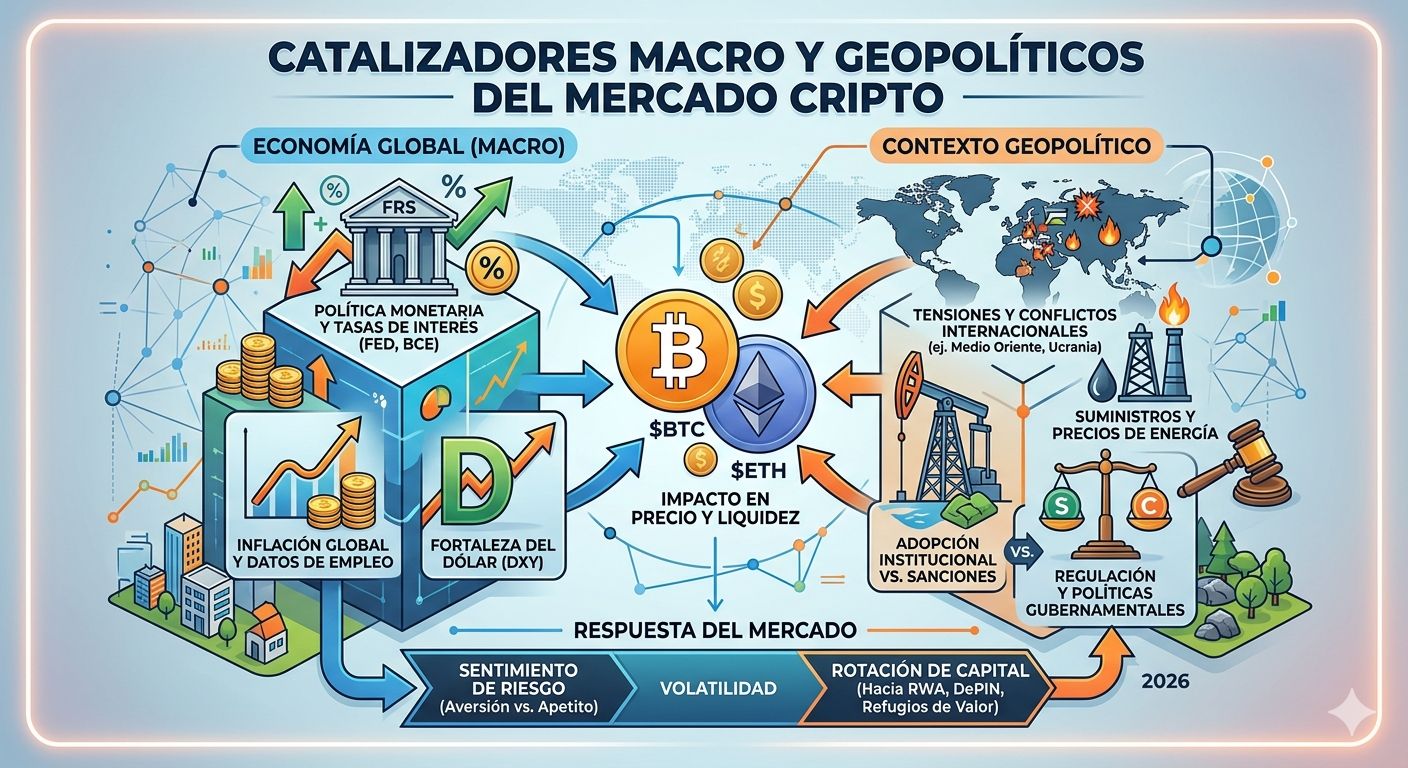
2. Macro and Geopolitical Catalysts
The "Black Swan" of March has been the escalation of tensions in the Middle East, directly affecting investor psychology:
Energy Impact:Oil surpassing$110 per barrelhas revived fears of persistent inflation, putting downward pressure on risk assets.
Monetary Policy: Uncertainty about the Fed's upcoming decisions (March meeting) and a strong dollar are draining liquidity from the crypto ecosystem towards Treasury bonds.
Correlation with S&P 500: Interestingly, Bitcoin's correlation with the traditional stock market is at lows, acting more as a thermometer for global liquidity and geopolitical risk.
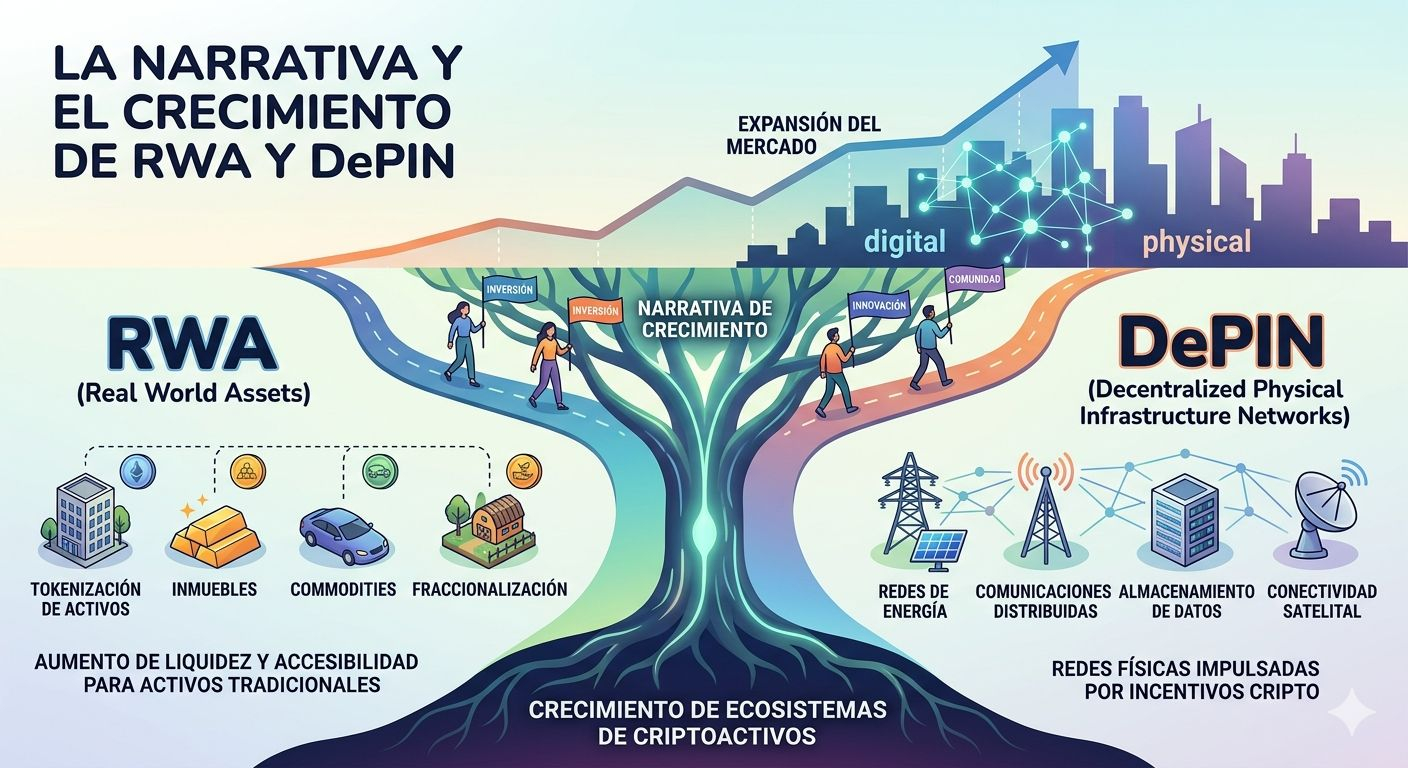
3. Growth Narratives: RWA and DePIN
Despite the drop in global capitalization in February (-22%), certain institutional sectors continue to expand:
Real World Assets (RWA): The tokenization of real assets (Treasury bills, gold, and real estate) reached an on-chain value of $25.4 billion. The recent approval of pilots for tokenized stocks by the SEC reinforces this trend.
Token Unlocks: March is a month of high selling pressure due to the release of approximately $5.8 billion in tokens from projects like $RAIN, $ASTER, $SUI, and $ZRO. This usually creates buying opportunities during corrections or warning signals for leveraged positions.
4. Conclusions and Strategy
The market is in a "compression zone."
Sentiment: The Fear and Greed Index hovers around "Extreme Fear" levels (14/100) during downturns, which historically has preceded technical rebounds in a V-shape.
Focus:Capital rotation seems to be moving towardsreal utility (RWA)andon-chain AI (AI Agents), temporarily moving away from pure speculation.
Risk Note: Current volatility suggests avoiding aggressive leverage in long positions until a clear breakout above $71,500 in BTC is confirmed with solid volume.
 BTCUSDTPerp77,632.1-0.38%