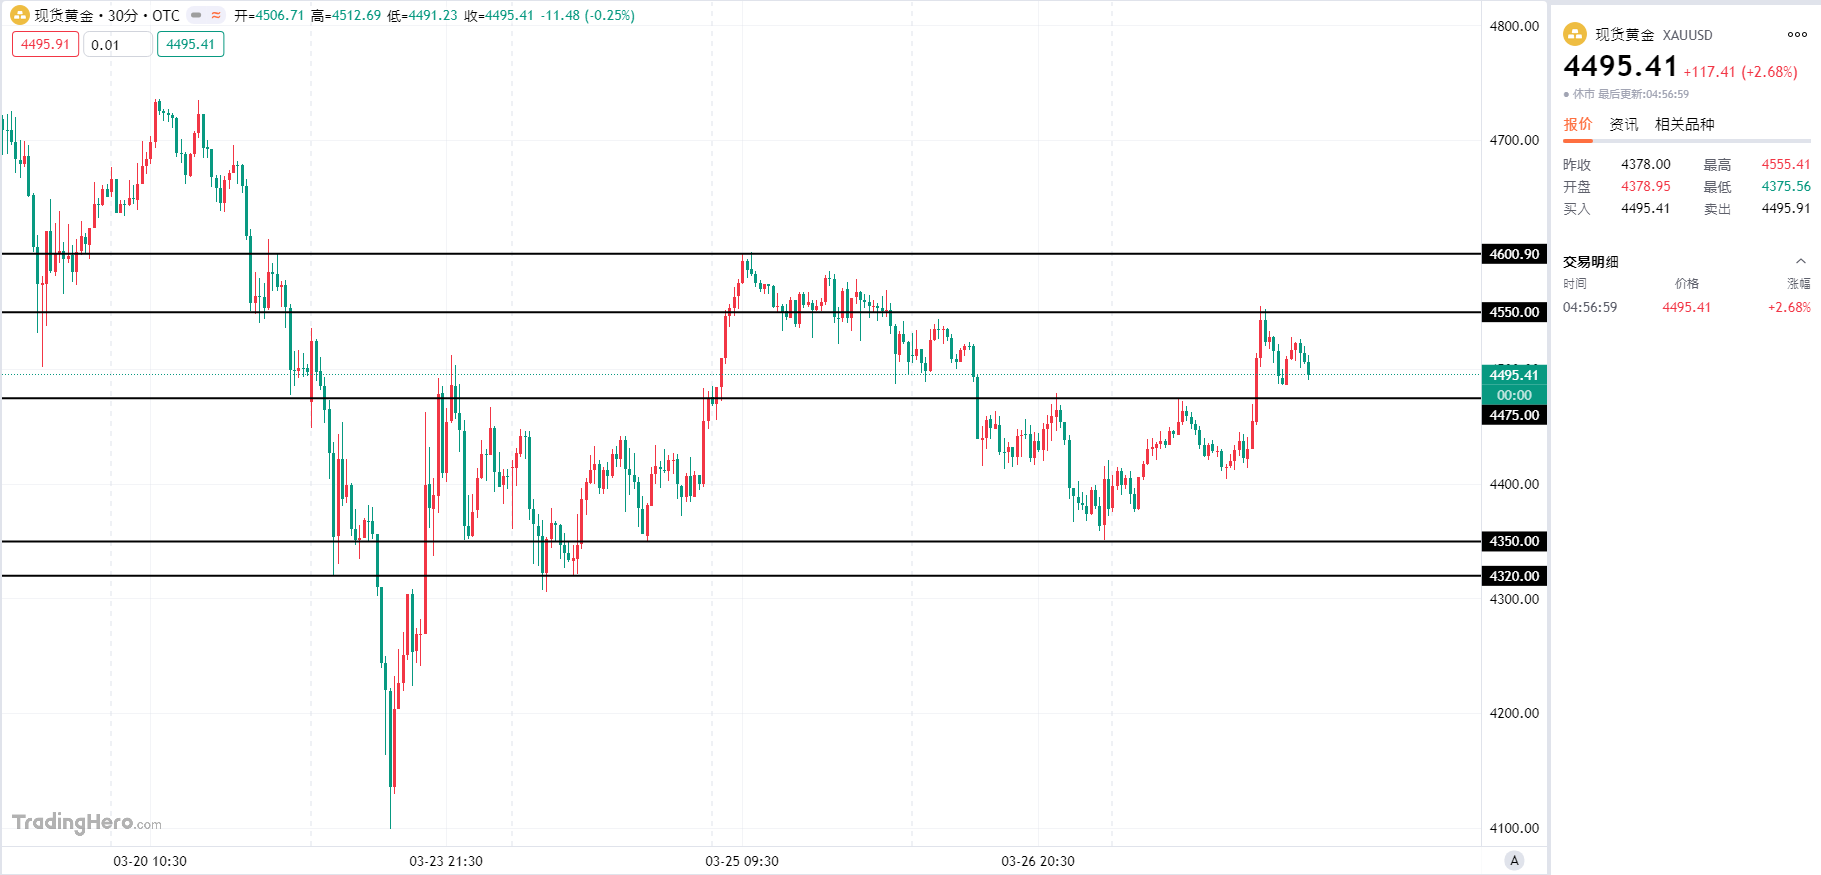
Gold Price Trend Analysis for Next Week:
This week, the gold price fluctuated over $300, first dropping sharply and then rebounding, overall stabilizing. At the beginning of the week, the gold price continued to fall, reaching a low of 4351, after which it began a strong rebound, with a daily increase of 3.18% on the 25th, the largest increase in recent days; however, the good times did not last long, as there was another drop of over 2% on the 26th, which erased a significant portion of the previous day's gains; in the last two days, the gold price gradually stabilized, rebounding slightly on key support levels, ultimately closing the week up. The main forces at play are two opposing factors: the Federal Reserve's tough stance, delayed interest rate cuts, and a strong dollar pressuring gold prices; but the tense situation in the Middle East is supporting gold prices due to safe-haven demand.
This week on the daily chart shows two bearish and three bullish candles, overall in a rebound recovery. The close is stable above the 13-day moving average, higher than the weekly opening price, and the volume has also increased, indicating that the short-term rebound is effective. Technically, the bearish strength of MACD is weakening, soon forming a golden cross; RSI is between 45-50, not overbought or oversold, indicating a strong oscillating state, currently without a one-sided trend.
Four Hour Level: Initially a sharp decline followed by a rebound, then narrow fluctuations. After a golden cross, MACD turned again, with fierce competition between bulls and bears; RSI rebounded from the oversold zone to around 50, the dividing line between bulls and bears, still fluctuating. Support is seen at 4440-4450, resistance at 4550, if resistance is broken, prices will continue to rise; if support is broken, it will drop below 4400.
Hourly Level: This week's volatility has been particularly high, with daily fluctuations exceeding $100. In the last two days, volatility has decreased, oscillating within $50, and market sentiment is stable. MACD has repeatedly crossed golden and dead crosses, with RSI fluctuating between 30-70 without a clear direction, indicating range-bound fluctuations. Pay attention to sudden news impacts.
Next week, gold will still experience wide fluctuations, with a bias towards strong oscillations and fierce competition between bulls and bears. Short-term: Buy near 4471 on pullback, stop loss at 4460, target at 4516; short near 4516, stop loss at 4527, target at 4473. Medium to long term: Buy near 4424, stop loss at 4400, target at 4600. Lao Yu suggests that next week's gold operations should focus on buying low and selling high, with upper resistance at 4555-4600 and lower support at 4450-4400.
Analysis of Oil Market Trend for Next Week:
Oil News: On Friday, US crude oil was around $101.10, with a significant increase in oil prices on Thursday. Brent rose by 5.7% to $108.01, while US crude oil rose by 4.6% to $94.48, primarily due to the ongoing tensions in the Middle East and diminishing hopes for the end of the war.
Technical Analysis: On the daily chart, affected by geopolitical factors, oil prices rose above $110, with moving averages trending upward. The medium-term trend is bullish, experiencing high-level fluctuations but strong bullish momentum. In the short term, the 1-hour chart shows low-level fluctuations, and MACD is slowly crossing above the zero line, indicating an increase in bullish strength, expecting a pullback first. Lao Yu suggests that next week's oil operations should focus on buying low and selling high, with upper resistance at 110.0-115.0 and lower support at 95.0-90.0.