Latest gold market trend analysis:
On Monday morning, the dollar continued to strengthen, reaching a new high in over half a month with five consecutive days of gains. Gold opened high around 4514 and then began to pull back, now down to around 4450, a nearly 1% drop. Although the tense situation in the Middle East has brought safe-haven buying, gold prices are still under downward pressure. Last week, gold experienced a large fluctuation of 'first drop then rise', affected by the Federal Reserve's interest rate hike expectations, dropping to a low of 4098; later, due to the escalation of the Middle East conflict and continuous gold purchases by central banks, combined with a technical rebound from oversold conditions, gold prices gradually recovered, closing at around 4491 on Friday, with the weekly candlestick showing a long lower shadow, indicating strong buying support below. As the new week begins, the market is relatively cautious, with bulls and bears tugging back and forth in a key range, focusing on whether the news and key positions can break through.
The negative factors have always been present and are the main reason why the gold price cannot rise. The latest Fed meeting minutes show a hawkish stance, with officials feeling that high interest rates need to be maintained longer, reducing the number of expected rate cuts from 2 to 1 this year, and delaying it until after September, much later than the market expected. Affected by this, US Treasury yields and the dollar index have strengthened, and since gold does not generate interest, the holding costs have increased, naturally suppressing it. Moreover, this week important data such as US inflation and non-farm payrolls will be released, raising market concerns that if the data is too good, the Fed is even less likely to cut rates, putting further pressure on gold prices. However, the tense situation in the Middle East and continuous gold purchases by global central banks are also supporting a rebound in gold prices.
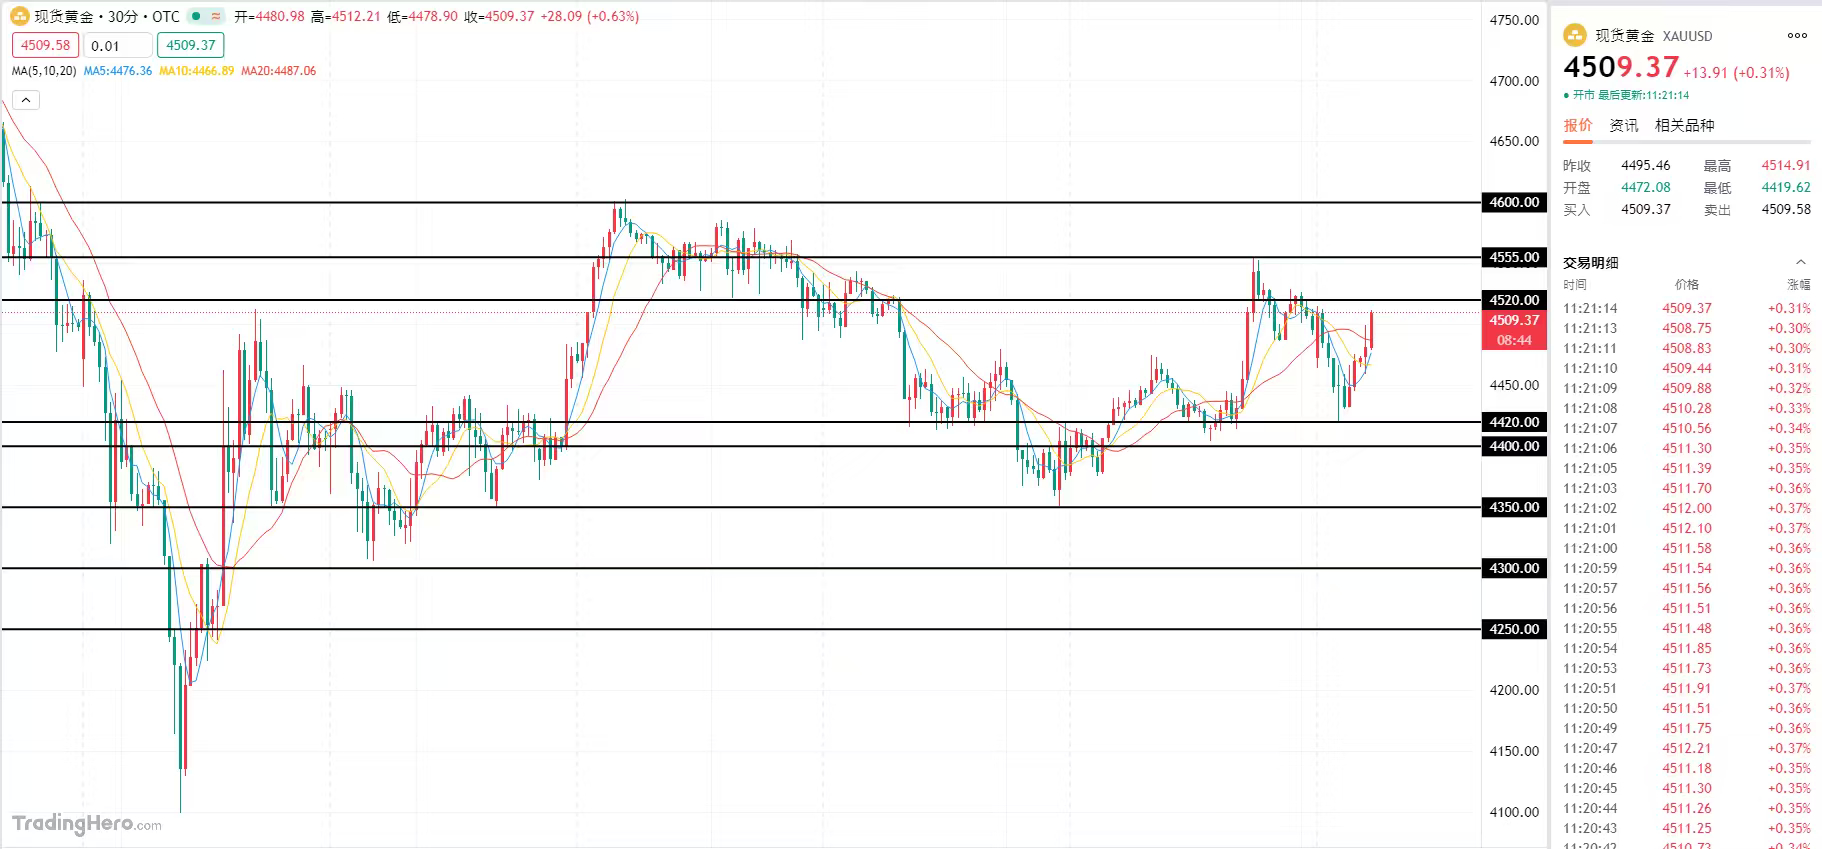
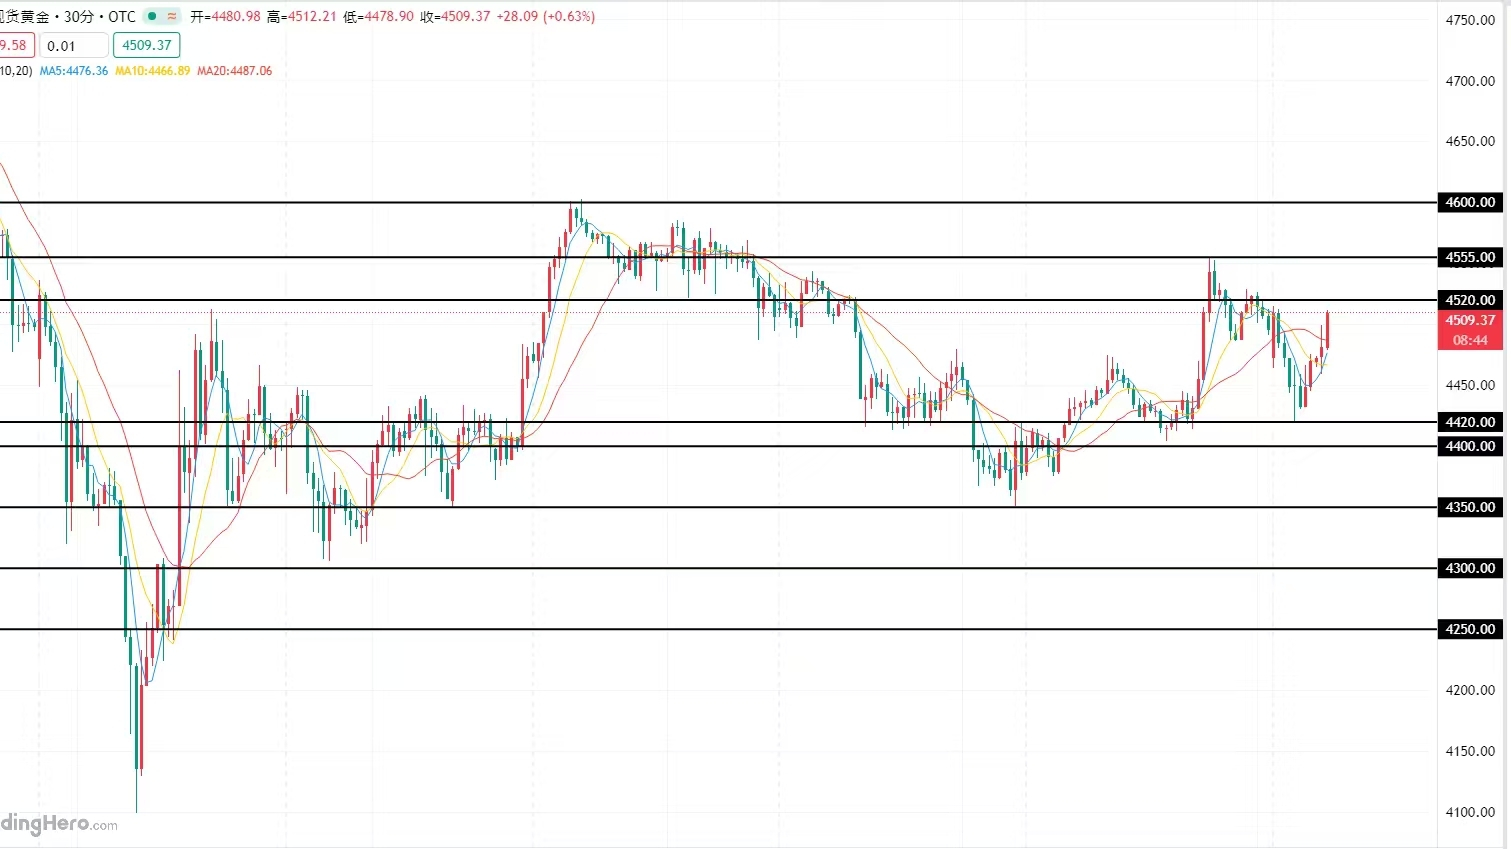
The key short-term support for gold is in the range of 4350-4400, which is this week's low point and a concentrated area for physical buying. If it breaks below this level, it may drop to 4250-4300, and further down to the previous low of 4100. The key resistance is at 4550-4600, which is a densely traded area before the big drop. It can only confirm a double bottom rebound if it stabilizes here, with a target of 4680-4750. Looking at the weekly chart, gold is still in a corrective phase after a high-level adjustment, with moving averages leaning bearish, but the indicators are rising from oversold conditions, indicating a demand for rebound. On the daily chart, after a rebound on Friday, it returned above 4490, showing a short-term tendency to oscillate and strengthen, but it must break through 4600 to be considered a reversal; otherwise, it will still experience wide fluctuations.
On the four-hour level, gold has undergone a V-shaped reversal followed by narrow fluctuations. The MACD has flattened after a golden cross, with buying and selling forces being roughly equal; the RSI has rebounded from oversold levels to around 50, which is a boundary position indicating that the current phase is one of oscillation. Short-term support is at 4440-4450, with resistance at 4550. If it breaks through 4550 today, the rebound space will open up; if it drops below 4440, it may return to fluctuate below 4400. Overall, the short-term strategy for gold today is: primarily long on dips, with short on rebounds as a supplement, looking at resistance at 4520-4555 above and support at 4420-4400 below.
Latest trend analysis for crude oil:
On Monday morning, international oil prices continued to surge, with US crude oil rising over 3% at one point, reaching a three-week high of 103.38, raising inflation expectations and also suppressing the possibility of a Fed rate cut, indirectly benefiting the dollar and negatively impacting gold. Last Friday, US crude oil fluctuated around 101, and on Thursday, oil prices surged, with Brent crude up 5.7% and US oil up 4.6%, mainly because the market believes the Middle East conflict will not end soon.
On the daily chart, crude oil surged above 110 due to geopolitical tensions, with moving averages diverging upwards, clearly indicating a bullish mid-term trend. After oscillating at high levels, the bullish momentum remains very strong, and the mid-term outlook is still bullish. In the short term, on the 1-hour level, crude oil is consolidating at low levels, which is part of an upward adjustment. The MACD is slowly crossing above the zero line, with bullish momentum gradually strengthening. Overall, the operational strategy for crude oil today is: primarily long on dips, with short on rebounds as a supplement, with resistance seen at 110.0-115.0 above and support at 95.0-90.0 below.#黄金 $XAU