Latest trend analysis of gold prices:
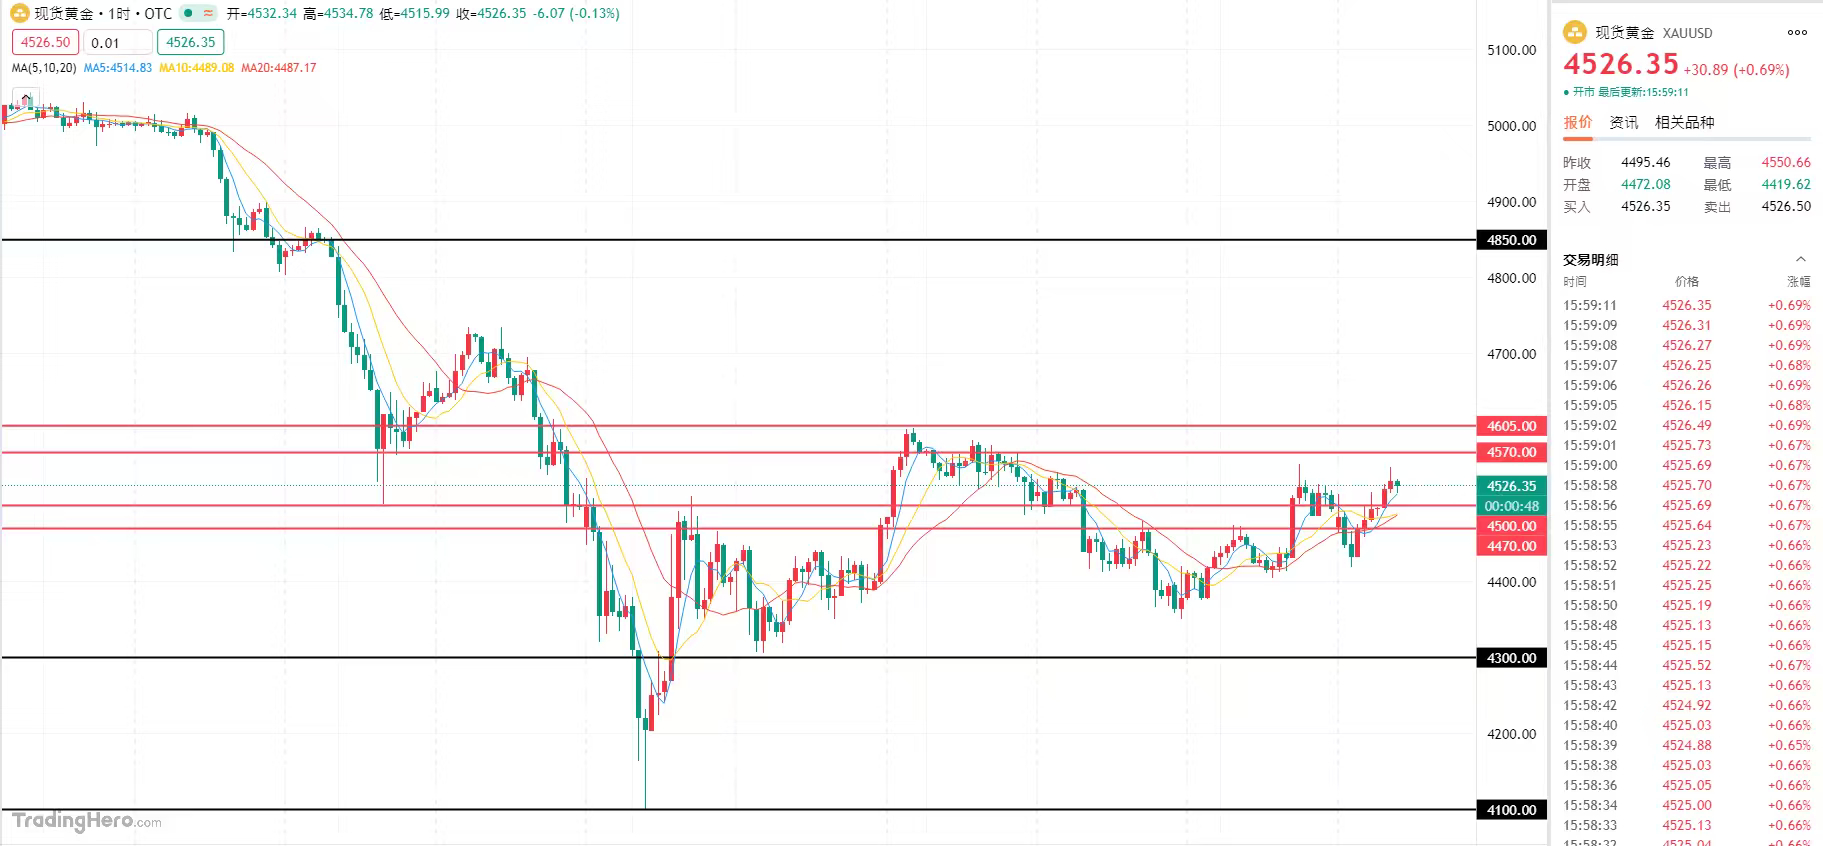
On Monday during the late session of the Asian market, spot gold first fell and then rose, currently in a rebound repair stage, with short-term trends relatively volatile, currently trading around $4525 per ounce, a daily increase of about 0.7%. The United States may take military action against Iran's uranium materials, significantly escalating geopolitical risks in the Middle East. If the conflict escalates, it will directly boost market risk-averse sentiment, providing strong support for gold; at the same time, the increase in nuclear proliferation risks and the potential extension of the war timeline may keep gold prices high or further rise in the medium to long term. Conversely, if diplomatic solutions are reached, risk-averse demand may temporarily decline.
From a technical perspective, the daily chart is under pressure below the 10-day moving average, currently remaining in a weak state. The major range this week is between 4600/4100. If it breaks below 4100, the next level to watch is 3850. Conversely, if it stabilizes above 4600, the next target above is 4850. In the H4 mid-term, it shows a low-level oscillation trend, with the Bollinger Bands narrowing and moving averages converging without divergence. The temporary range is between 4600/4300. As long as this range is not broken in the short term, effective high sell and low buy strategies can be implemented. This week is a non-farm data week, and with both geopolitical and data stimuli, this range trend can be maintained until the ADP data on Wednesday, followed by unemployment claims data on Thursday, and non-farm data on Friday, which may open up the oscillation pattern. Therefore, in the first three days of this week, both long and short opportunities exist, while the last three days will depend on changes in geopolitical situations and the impact of important news to judge the specific trend of gold. Overall, Lao Yu suggests that today’s short-term operational strategy for gold should focus on buying on dips while considering selling on rebounds, with short-term key resistance above at the 4570-4605 line and short-term key support below at the 4500-4470 line.
Latest crude oil market trend analysis:
On Monday during the Asian trading session, international crude oil prices continued to show strong performance, with the U.S. benchmark WTI crude oil achieving a rise for the fourth consecutive trading day and re-entering the important psychological threshold of $100 per barrel. The core driver of this round of increase comes from the further escalation of the situation in the Middle East, especially the heightened shipping security risks in the Red Sea, raising new concerns in the market about the stability of global energy supply.
From a technical perspective, on the daily chart, crude oil maintains an overall strong upward structure, with prices forming new platform support after breaking through $100. The key support below is around $96, while the resistance above is focused on the $105 area and the previous high of $113.28. Although overall momentum has slowed down, the trend has not changed. In the 4-hour cycle, oil prices show a pattern of high-level oscillation upward, and the short-term moving average system remains in a bullish arrangement. However, momentum indicators show signs of fatigue. If it falls below $98, it may test the $96 support area; if it breaks above $105, it is expected to further open upward space. Overall, today’s operational strategy for crude oil, as suggested by Lao Yu, is to focus on buying on dips while considering selling on rebounds. The short-term resistance above is focused on the $110.0-$115.0 line, while the short-term support below is focused on the $95.0-$90.0 line.#黄金 $XAU