Latest gold market trend analysis:
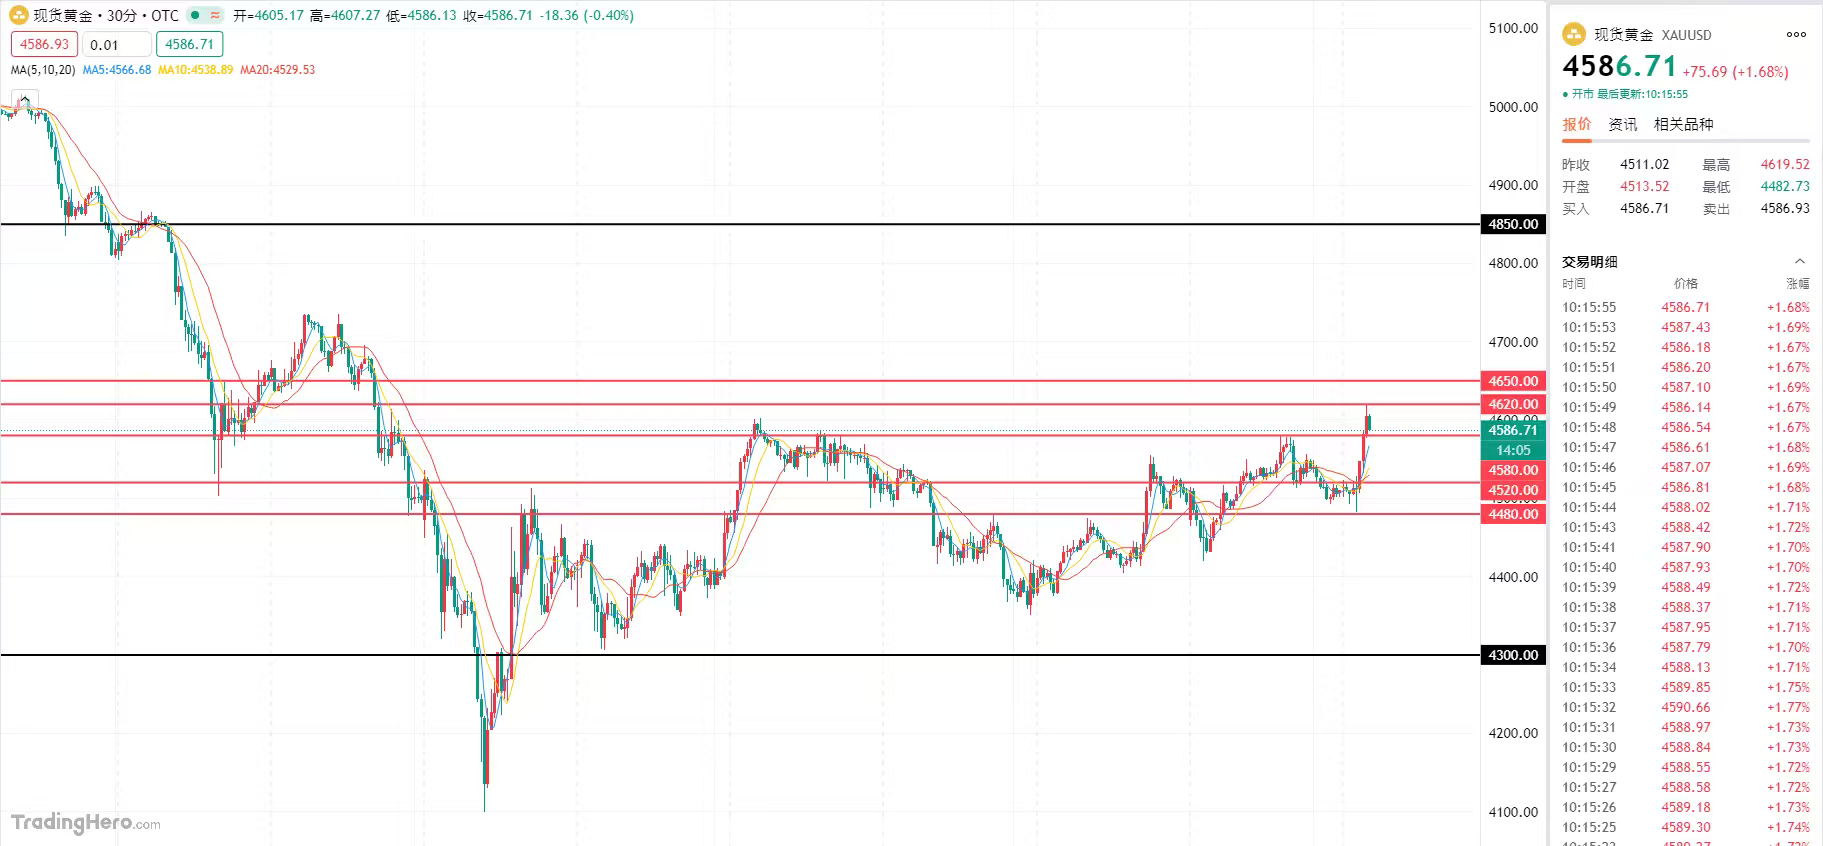
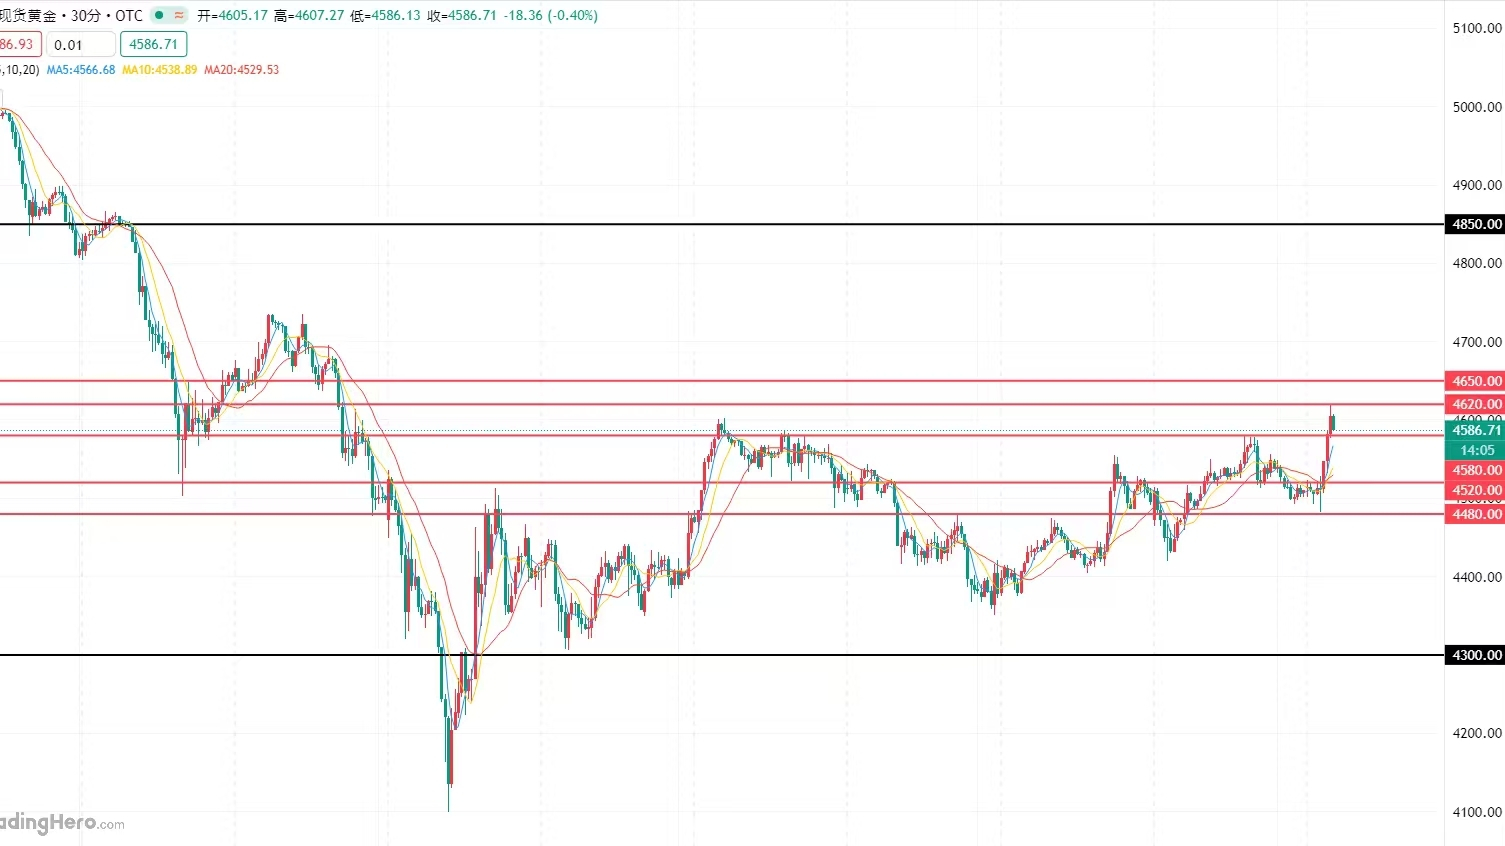
On Tuesday morning, gold surged to $4619 and is currently fluctuating around $4590. Yesterday, gold prices rose for the second consecutive day, primarily due to the ongoing conflicts in the Middle East, which have heightened risk aversion among investors. Although the market now believes that the Federal Reserve is unlikely to cut interest rates this year, gold has still increased. Yesterday, spot gold closed up 0.6%, reaching $4518.57 per ounce, while U.S. futures gold rose by 0.7% to $4557.50. The main reason is the tense situation in the Middle East, with Trump warning Iran that if it does not open the Strait of Hormuz, its oil wells and power plants will be destroyed. Iran has also retaliated, stating that the U.S. proposal is unrealistic and has fired missiles at Israel, which has raised concerns about inflation and rising interest rates, leading to a stronger safe-haven demand for gold.
From the market perspective, the 4-hour gold level is fluctuating back and forth at a high position, with the Bollinger Bands starting to narrow. The price is oscillating around $4500, and although the MACD is still in a golden cross, the red bars are shortening, indicating that the bullish strength is weakening. The RSI is nearing the overbought zone at 70, suggesting a possibility of a pullback. The short-term moving averages are still in a bullish arrangement, but the support strength is not as strong. At the 1-hour level, gold is experiencing narrow fluctuations after a high, with the upper Bollinger Band pressing on the price, and there is support at the middle band. The MACD red bars continue to shorten, the RSI has returned to a neutral range, and the candlestick is showing small gains and losses, with nearly equal bullish and bearish forces. Overall, in the short term, gold is in a fluctuating market, focusing on whether key points can be broken. Therefore, at the beginning of the week, it is suggested to sell high and buy low; consider shorting near 4640-4650, with a stop loss at 4670, and target around 4550, paying close attention to whether 4650 can hold. In general, the short-term trading idea for gold today is primarily to buy on pullbacks and secondarily to sell on rebounds, with key resistance at 4620-4650 above and key support at 4580-4520 below.
Latest trend analysis of crude oil:
On Tuesday morning, U.S. crude oil fluctuated around $106.08 per barrel, with prices soaring nearly 4% yesterday. This is mainly due to the Houthi attacks on Israel for the first time, escalating related conflicts in Iran, raising concerns over the safety of shipping routes in the Red Sea and around the Arabian Peninsula, thus pushing oil prices higher. Yesterday, U.S. crude oil closed above $100 per barrel, the first time since 2022. Brent crude oil is also likely to record the largest monthly increase this month, primarily due to the escalation of Middle Eastern conflicts and rising risks in oil transportation.
Crude oil technical analysis: From a technical perspective, the daily level of crude oil is still in an upward trend, with new support established after breaking above $100. The key support is around $96, while resistance is seen at $105 and the previous high of $113.28. Although the upward momentum has weakened, the upward trend remains unchanged. At the 4-hour level, crude oil is oscillating upwards at a high level, and the short-term moving averages are still in a bullish arrangement, but the momentum indicators are flattening; if it falls below $98, it may drop to the support level of $96; if it breaks above $105, it can continue to rise. Overall, today’s trading idea for crude oil is mainly to buy on pullbacks and secondarily to sell on rebounds, with short-term resistance seen at 115.0-120.0 above and short-term support at 100.0-95.0 below.