Latest gold market trend analysis:
On Tuesday morning in the European market, spot gold fluctuated narrowly, currently trading around $4550 per ounce. On Monday (March 30), spot gold rose slightly for the second consecutive trading day, with an increase of about 0.36%, closing at approximately $4510 per ounce, and hitting as high as $4580 during the session; U.S. futures gold also rose by 0.7%, settling at $4557.50. However, despite a slight recovery in short-term risk aversion, gold has accumulated a decline of more than 14% in March so far, poised to record its worst monthly performance since the 2008 financial crisis. Behind this abnormal trend is a complex game intertwined with escalating Middle East conflicts and macroeconomic pressures. The war has driven up oil prices and intensified inflation fears, while the Federal Reserve maintains a cautious stance, leading to a sharp adjustment in market expectations for the interest rate path. Investors are generally concerned about whether the short-term rebound in gold can be sustained and whether it will regain upward momentum in the long term. On this trading day, the U.S. February JOLTs job openings data will be released, which investors need to pay attention to.
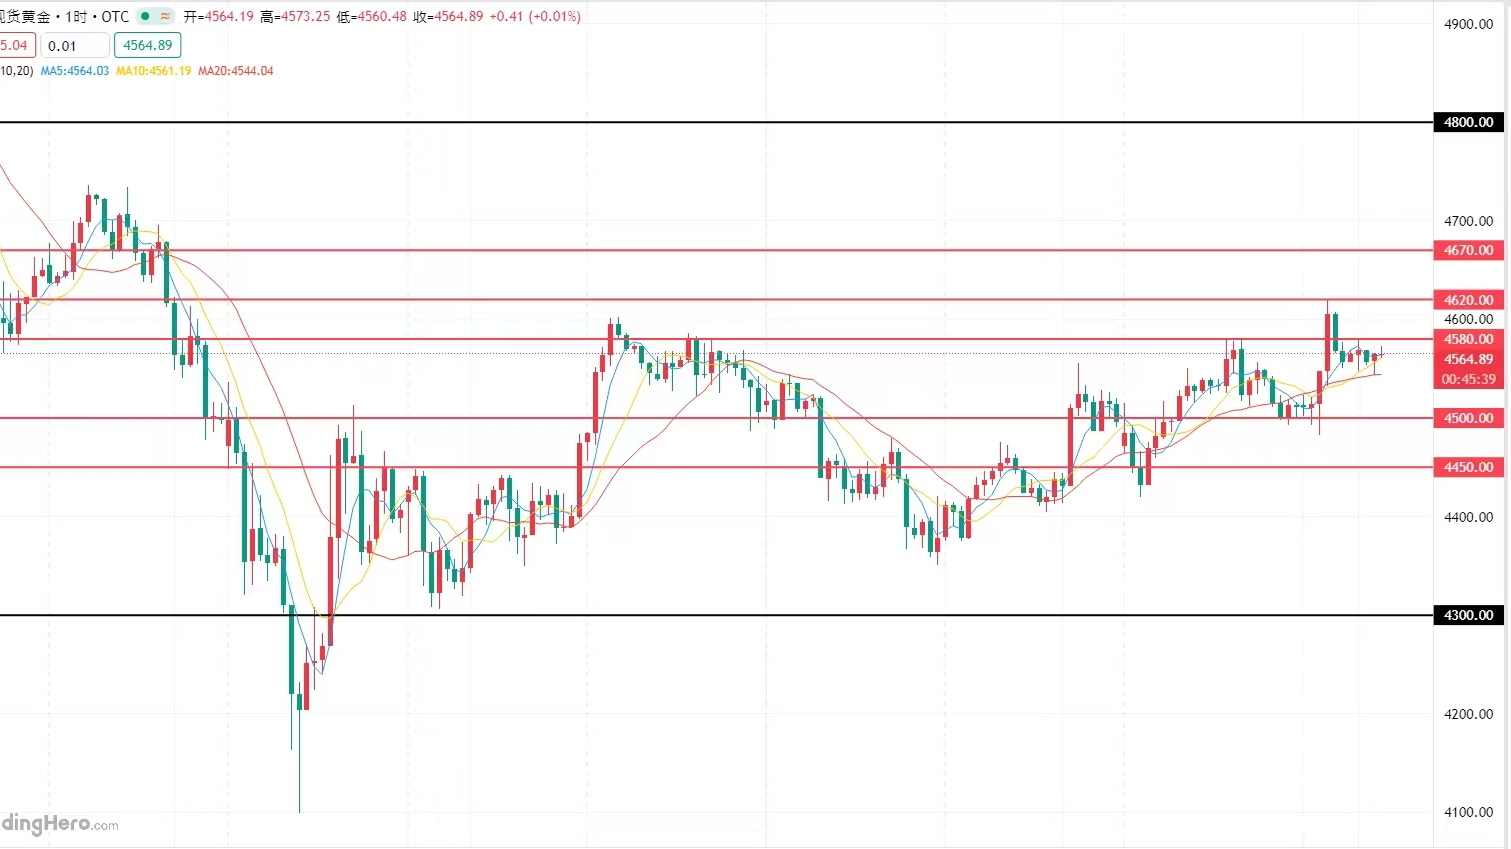
Gold showed a volatile back-and-forth trend yesterday, first retreating to stabilize around the 4420 line in the morning, then continuing to fluctuate and rebound, with the high point briefly touching the 10-day moving average near 4580. However, in the evening session, the bullish momentum weakened, and the market once again retreated to around 4500 for consolidation. Ultimately, the daily line closed with a candlestick that has upper and lower shadows, reflecting both the fierce contest between bulls and bears and a temporary hesitation in the market. From the daily line structure, yesterday's bullish close was above the 5-day moving average but under pressure below the 10-day moving average. This pattern indicates that while the short-term market retains technical adjustment expectations, the rebound momentum has not completely faded. It is noteworthy that the recent rhythm of gold has a strong correlation with the US dollar index, showing a typical negative correlation; a strong dollar pressures gold, while a weak dollar supports gold. This logic has been fully validated by recent market practice. This morning, the US dollar index showed a retreat (currently trading around 100.49, slightly lower than yesterday's closing price), and gold has welcomed a wave of rises, successfully breaking through the 10-day moving average resistance, with the market now standing above the 4600 mark. From the daily line structure, gold has broken through short-term technical resistance, and at this rhythm, the rebound space above is expected to further expand, with the possibility of testing above the 20-day moving average of 4800. However, it must be clear that the current rise completely relies on the adjustment of the US dollar index; whether it can continue to rise later still needs to closely track the US dollar index movement. The outlook suggests that for today's short-term trading strategy, it is advisable to focus on buying on dips and to sell on rebounds, with key short-term resistance to watch at the 4620-4670 line and key short-term support to watch at the 4500-4450 line.
Latest trend analysis of crude oil:
On Tuesday morning in the European market, US crude oil traded around $103.38 per barrel, with oil prices rising nearly 4% on Monday. The Houthi movement in Yemen launched its first attack on Israel, further escalating the conflict in Iran and intensifying market concerns over maritime shipping in the Red Sea and oil transport routes around the Arabian Peninsula. Oil prices closed higher on Monday, with the settlement price of US crude oil futures breaking $100 per barrel for the first time since 2022. Brent crude oil futures are expected to record a record monthly increase, mainly due to the Houthi attack on Israel, which has further intensified the Iranian conflict and raised market concerns over maritime shipping in the Red Sea and oil transport routes around the Arabian Peninsula. From the perspective of investor focus, the current market is closely watching whether the Strait of Hormuz will resume navigation, the progress of negotiations between the United States and Iran, and the safety status of energy facilities. If the conflict escalates further, oil prices still have room to rise; however, if there are signs of easing in the situation, it may trigger a correction from high levels.
From a technical perspective, on the daily level, crude oil is still in an upward trend, but momentum has weakened as prices approach the $106 mark, showing a short-term high-level fluctuation pattern. Key resistance levels to watch above are the $108 area (previous structural level) and selling pressure near psychological levels, while important support below is at the $100 integer level. If this level is broken, it may open up further adjustment space. On the 4-hour level, there are obvious signs of overbought conditions, and momentum indicators are gradually retreating, indicating a short-term technical correction demand. If the high point area cannot be effectively broken, oil prices may enter a wide fluctuation range, with volatility significantly increasing. Overall, for today's trading strategy, it is advisable to focus on buying on dips and selling on rebounds, with key short-term resistance to watch at the 110.0-115.0 line and key short-term support to watch at the 100.0-95.0 line.