⏰ The Bitcoin Cycle Clock 🌀
What is the Bitcoin H-Clock and what does it tell us about the current market?
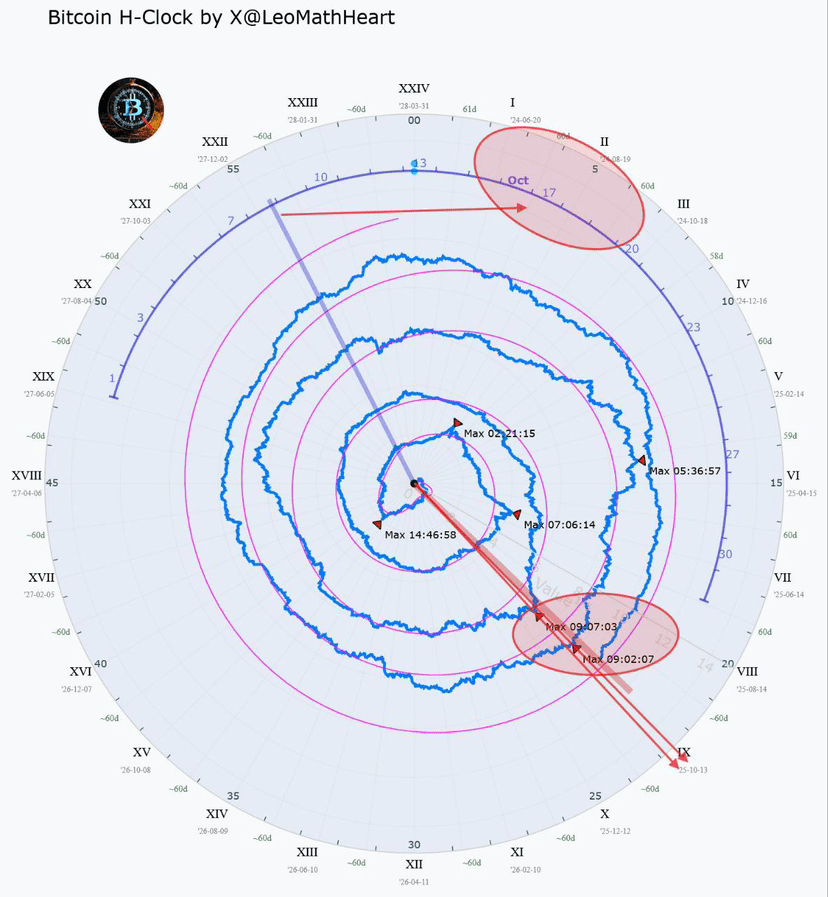
The Bitcoin H-Clock, created by @LeoMathHeart, is a tool that shows Bitcoin cycles in the form of a spiral clock
Instead of measuring time linearly, this chart represents how the price behaves within each halving cycle (every 4 years, when the reward to miners is reduced)
🔹 Each turn of the spiral represents a complete cycle, from one halving to the next.
🔹 The Roman numerals (I, II, III… XXIV) represent the 'months' or phases of the cycle.
🔹 The blue lines show the price action.
🔹 The red zones mark key moments, where historically Bitcoin reaches highs or enters acceleration phases.
🧠 How to read it:
The clock has 24 divisions, like the hours in a day.
Each 'hour' equals about 60 real days.
At the center are the first cycles (2012-2016), and as we move outward, we see the more recent cycles (2020-2024 and the current 2024-2028).
The 'Max' points indicate previous price peaks (2017, 2021, etc.), and draw a timeline that allows projecting the next maximum.
📍 Where we are today (October 2025)
According to the H-Clock, Bitcoin is in phase IX of the current cycle, right where historically the final acceleration of the bull run begins.
This coincides with the period before the cycle highs, where:
There is more institutional entry,
Altcoins begin to take off (start of altseason),
And the media interest skyrockets.
The model suggests that the market's maximum peak could occur between October and December 2025, before entering a new distribution phase.
💬 In summary:
The H-Clock does not aim to predict exact prices, but to show the temporal pulse of the Bitcoin cycle.
It reminds us that the market moves in rhythmic patterns, and understanding the timing of the cycle can be as important as the price itself.
🕰️ Time in Bitcoin is cyclical.
And those who understand the cycles, understand the market.
#Bitcoin #BTC #Crypto #BitcoinCycles #Trading #BlockBrainMX #FirstLearnThenInvest
