Latest trend analysis of gold market
On Thursday, in the Asian market's early session, spot gold continued its upward trend. As of 07:31, it once refreshed the highest point since March 19 at $4800.33 per ounce, with an increase of about 0.89%. Boosted by the dual factors of a weaker dollar and easing expectations in the Middle East situation, gold prices rose for the fourth consecutive trading day on Wednesday (April 1), with spot gold reaching a high of $4792, ultimately closing up 1.9% at $4758 per ounce, while U.S. futures gold surged 2.9% to $4813.10. Currently, investors are closely focused on the upcoming nationwide speech by Trump. This week, attention will shift to Friday's March non-farm payroll report, with economists predicting the addition of 60,000 jobs. If the labor market shows a sharp deterioration, it will reignite expectations for interest rate cuts by the Federal Reserve this year. Previously, the market had largely ruled out the possibility of rate cuts due to rising oil prices and inflation concerns from the Iran war.
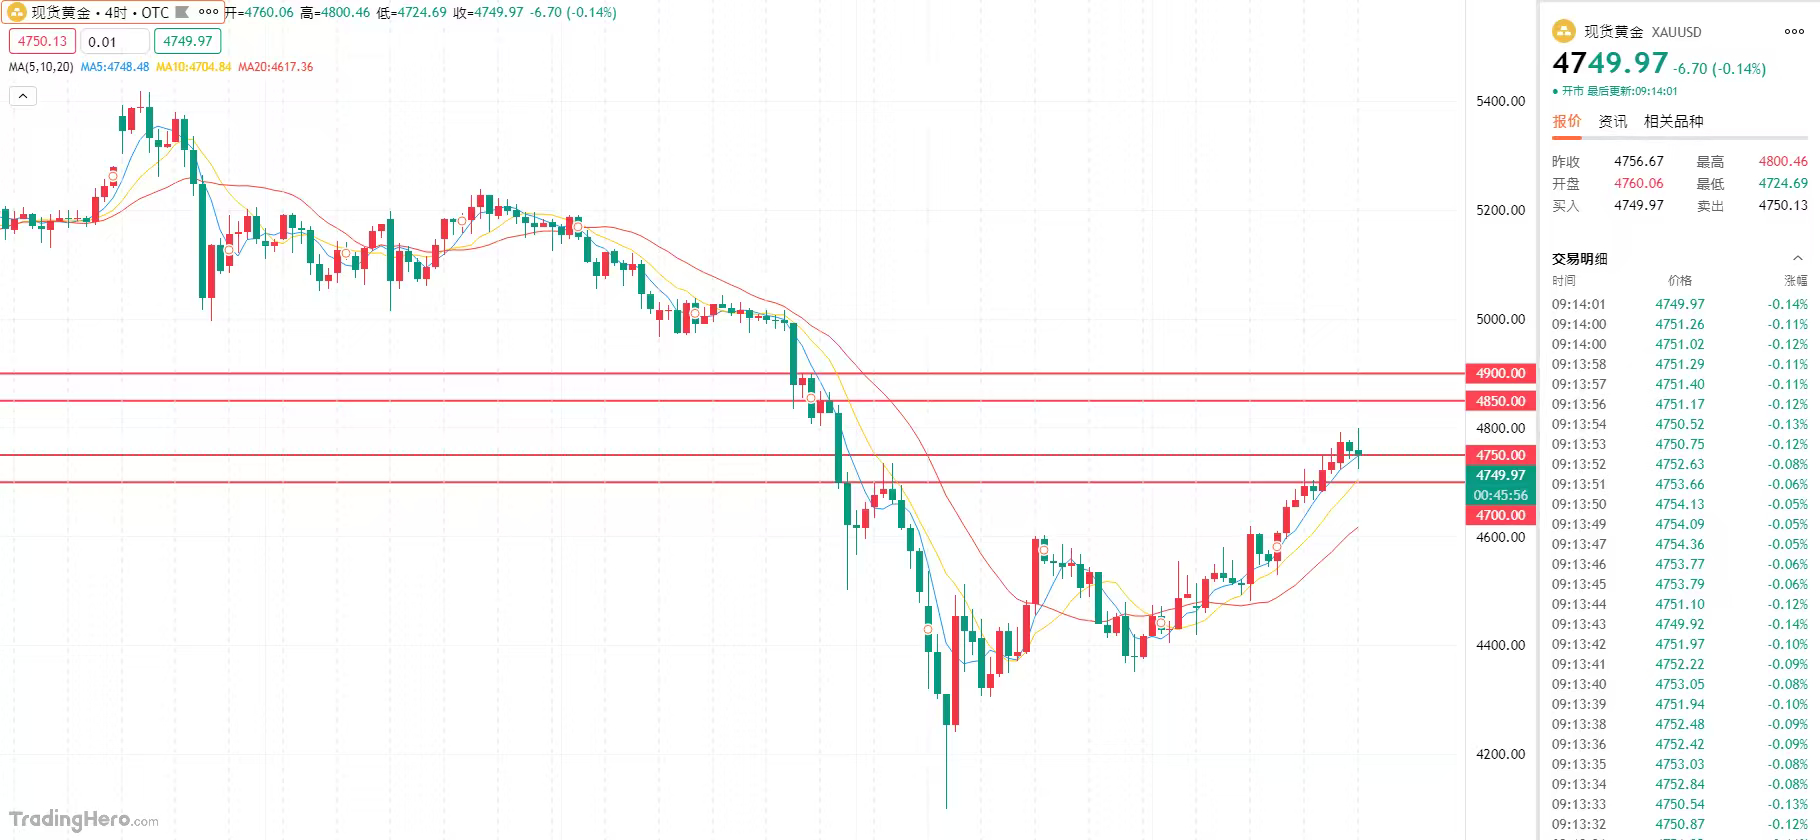
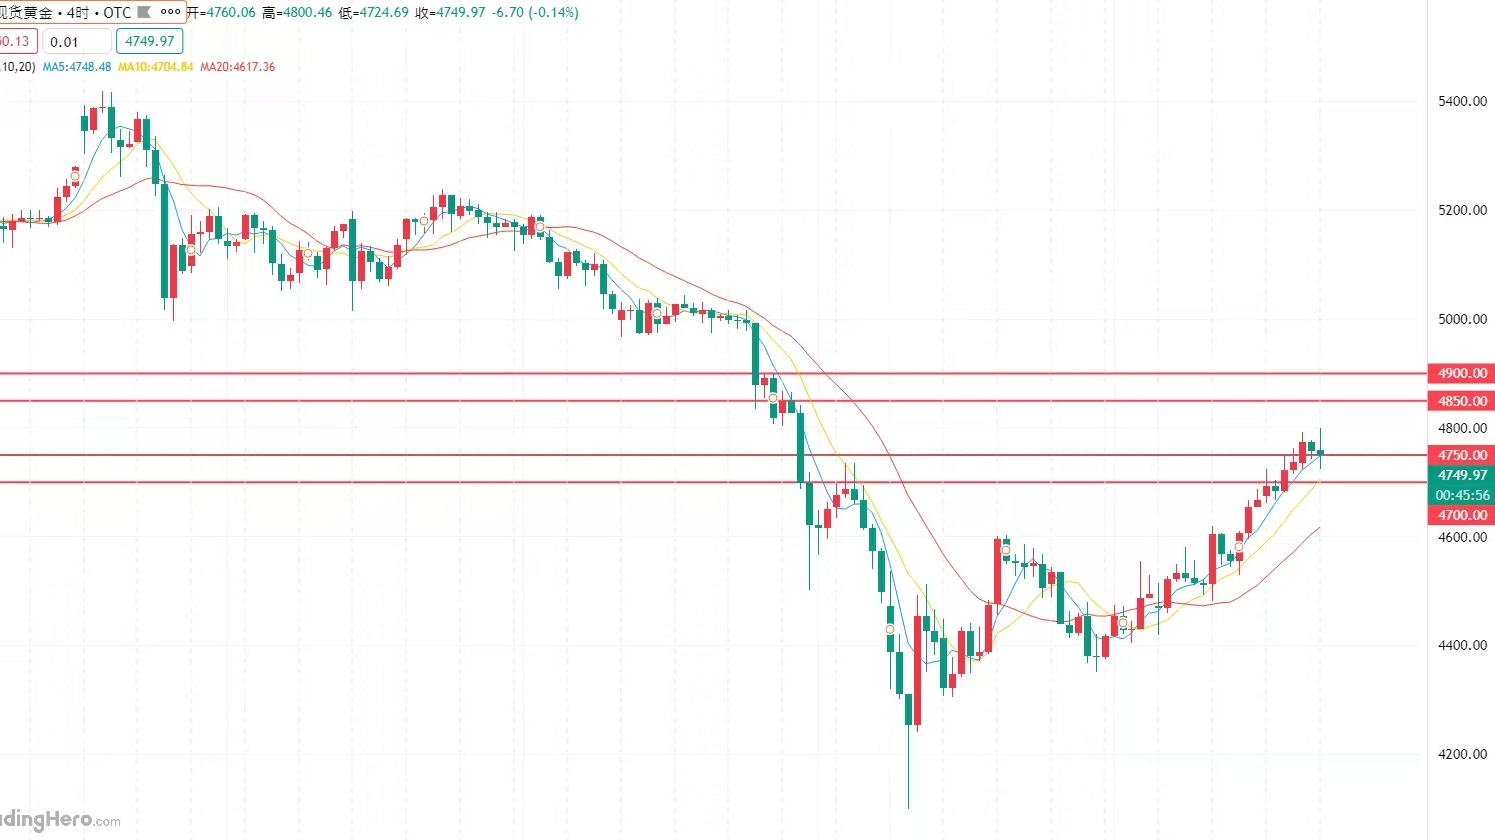
From a technical perspective, the overall oscillation is slightly strong, but there are clear resistance signals above. On the daily level, gold prices oscillate upward relying on the short-term moving average, stabilizing after multiple tests of the $4680 key support, showing a stepwise upward trend. However, it encounters strong resistance near $4800. The MACD indicator maintains red bars, and although bullish momentum has not completely faded, the amplitude of the red bars is gradually narrowing; the RSI indicator is close to the overbought zone, indicating insufficient upward momentum. On the 4-hour level, the Bollinger Bands open upward, and gold prices oscillate upward along the middle track, but the upper track near $4800 shows significant pressure, with multiple highs encountering resistance and failing to form an effective breakthrough. The oscillation range is gradually narrowing, intensifying the tug-of-war between bulls and bears. The gold price's 1-hour trend is weak, forming a short-term divergence with the overall strong oscillation pattern. Gold prices have broken below the short-term moving average support, showing a slight downward trend, while the MACD indicator's red bars continue to shrink, gradually approaching the zero axis, releasing bearish momentum. The RSI indicator has retreated to a neutral and weak range, with insufficient upward momentum. The Bollinger Band trend is slightly downward, with gold prices running below the middle track, showing short-term downward pressure, and further attention is needed on support levels. Overall, for today’s short-term operational strategy on gold, it is advisable to focus on buying on dips and supplementing selling on rebounds. The key short-term resistance to watch above is the $4850-4900 range, while the key short-term support to watch below is the $4750-700 range.
Latest crude oil market trend analysis
On Thursday morning in the Asian market, oil prices fell more than 1%, trading around $98.25 per barrel. U.S. President Trump stated that the U.S. will soon end the war with Iran. Oil prices closed lower on Wednesday as President Trump announced that the U.S. would soon end the war with Iran. Brent crude futures fell 2.7% to $101.16 per barrel, touching a low of $98.35 during the session. U.S. crude futures fell about 1.2% to $100.12 per barrel, hitting a low of $96.50 in intraday trading. Meanwhile, OPEC's March crude oil production dropped by 7.5 million barrels per day due to the Strait's closure, U.S. crude oil inventories rose more than expected last week, and Saudi Arabia may raise the official selling price of crude oil to Asia to record levels in May.
From a technical perspective, the daily oil price is still in a high consolidation range, with prices repeatedly encountering resistance near $108, indicating heavy selling pressure above, while the key support area is at $100, reflecting bulls' defensive willingness. Momentum indicators show that upward momentum has weakened, but no trend reversal signal has formed yet. On the 4-hour level, the short-term trend shows a weak oscillating structure, with prices repeatedly testing support and resistance within the range. If it effectively breaks below $100, it may trigger technical stop-loss orders and accelerate the decline; conversely, if geopolitical risks escalate again and push the price above $108, it may open up new upward space. Overall, today’s operational strategy for crude oil is to focus mainly on buying on dips and supplementing with selling on rebounds. The short-term resistance to watch above is the $103.0-108.0 range, while the support below is the $93.0-88.0 range.#黄金 $XAU