Latest trend analysis of gold prices:
On Monday, international gold opened lower, mainly because last Friday's unemployment rate and non-farm data were better than expected. Additionally, Trump stated that if the Strait of Hormuz is not reopened, he will strike Iran's energy facilities. This directly pushed oil prices up, causing gold prices to be suppressed initially. However, the concern about rising oil prices and inflation is not as strong for gold, and since the year-on-year and month-on-month average wage for March has overall decreased, gold prices did not drop as much as everyone expected in the early trading.
This week, the focus is on the U.S. March CPI year-on-year and month-on-month data. The market currently believes that the data will rise significantly. If this is the case, it will make everyone think that inflation is about to rise again, greatly reducing the possibility of the Federal Reserve lowering interest rates this year. Some may even discuss raising interest rates, which would severely suppress gold prices, possibly dropping to 4460 or 4300. Conversely, if the data does not meet expectations, gold prices will fluctuate; if they are similar to or lower than the previous value, gold prices will surge, with a chance to reach 4840 or 5000.
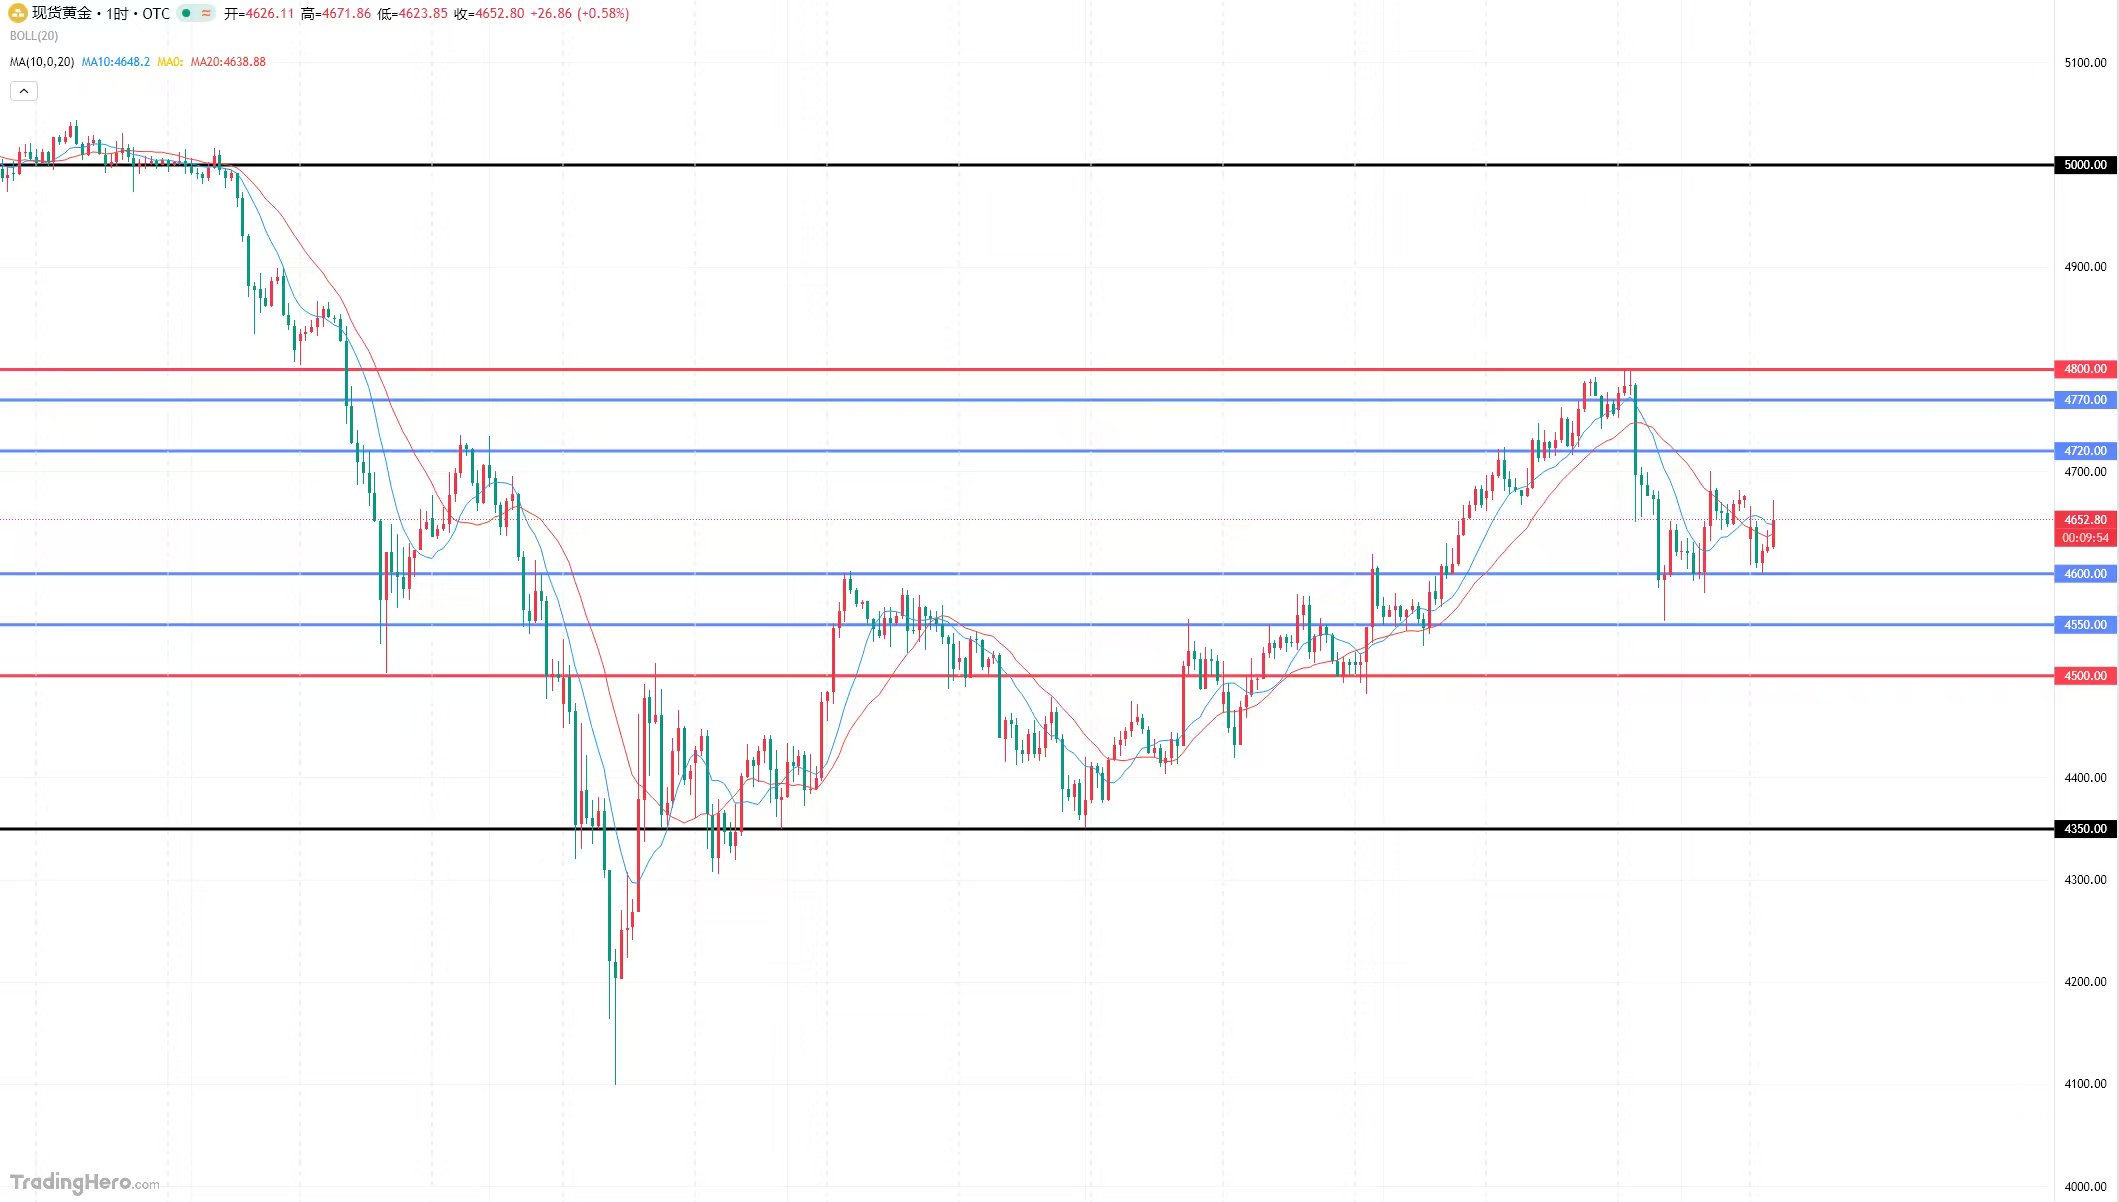
From a technical perspective, gold previously rose from 4100 to 4800 and then stalled, with a large bearish candle interrupting the continuous upward trend on the daily chart. The daily chart has continued to show bearish closes and has fallen below the middle band of the Bollinger Bands, clearly indicating that gold has weakened again. If this weakness persists, it will surely test the lower points again. Therefore, since this week has been confirmed as weak, one should follow the trend and look for short positions. The 4-hour cycle shows a range of fluctuations, the Bollinger Bands are narrowing, and the moving averages are sticking together, making it difficult to see a one-sided trend for now. There is pressure at 4800 above and support at 4500 below; until this range is broken, gold will continue to fluctuate with the market. Once a key position is broken, we can look for a one-sided trend based on news. Therefore, I believe that this week gold will fluctuate back and forth in the 4800-4500 range; if it doesn't break, trade boldly within the range, but if it breaks, follow the market trend. As mentioned last week, above 4800 we can see 5000, and below 4500 is 4350. Overall, today, the short-term operation strategy for gold suggests focusing on long positions during pullbacks and short positions during rebounds, with short-term resistance at 4720-4770 and support at 4600-4550.
Latest trend analysis of crude oil:
On Monday morning during the Asian session, US crude oil rose nearly 3%, fluctuating around $110.42/barrel. Trump has threatened to destroy Iran's power plants, while Iran has not agreed to the US's demands to end the war. Oil prices surged last Thursday, with US crude oil futures rising 11.41%, closing at $111.54/barrel, marking the largest single-day increase since 2020; Brent crude oil futures rose 7.78%, closing at $109.03/barrel. This is mainly because Trump stated that he would continue to strike Iran and did not specify when hostile actions would cease, and it is also uncertain when the Strait of Hormuz will reopen.
From a technical perspective, crude oil has risen from the low point in December 2025, and the long-term upward trend has not been broken. Although there was significant fluctuation this week, it briefly fell below the middle band of the Bollinger Bands, but buying pressure quickly came in, indicating that the $100 level is being defended firmly. Currently, the upper band of the crude oil Bollinger Bands is at $108.93/barrel, and the current price has already broken through this level, leading to some short-term rapid gains, indicating slight overbought conditions. The MACD indicator shows that the red bars for US crude oil are starting to lengthen again, with DIFF and DEA turning upwards at high levels, indicating that bullish momentum is returning; however, the MACD for Brent crude oil has shown a death cross, suggesting that international oil prices are weaker in the face of negative factors, with significant divergence between the two types of crude oil. The RSI indicator shows that US crude oil is approaching the overbought zone at 70, so caution should be exercised for short-term high positions as profit-taking may lead to sudden declines. Overall, today, the operation strategy for crude oil suggests focusing on long positions during pullbacks and short positions during rebounds, with short-term resistance seen at 119.0-124.0 and support at 105.0-100.0.#黄金 $XAU