Latest trend analysis of gold prices:
On Monday, gold opened by moving downwards, mainly because last Friday's U.S. employment data was better than expected, coupled with Trump's remarks that if the Strait of Hormuz is not opened, Iran's energy facilities will be attacked. Oil prices opened higher, causing gold prices to be suppressed initially. However, the market's concerns about rising oil prices and increasing inflation are not that strong, and combined with the overall slowdown in wage growth in March, gold prices did not fall as much as everyone expected in the morning.
This week, the focus is on the U.S. March CPI data, with the market expecting the data to rise significantly. If this is the case, the expectations for rising inflation will be stronger, and the probability of the Federal Reserve cutting interest rates will decrease significantly. Some may even discuss raising interest rates, and gold prices could drop to 4460 or 4300. If the data is worse than expected, gold prices will fluctuate; if it is lower than the previous value, there will be a significant rebound, potentially reaching 4840 or 5000.
Technically, after testing the bottom on the weekly chart, there are signs of recovery and a halt in the decline. The bearish force is weakening, and it is difficult to see a significant drop without major negative news in the short term. However, the 5-week and 10-week moving averages are still exerting downward pressure, making it unlikely to rise significantly in the short term. It is more probable that there will be back-and-forth fluctuations until the K-line stands above the middle band and the 5-week moving average before a strong upward move occurs.
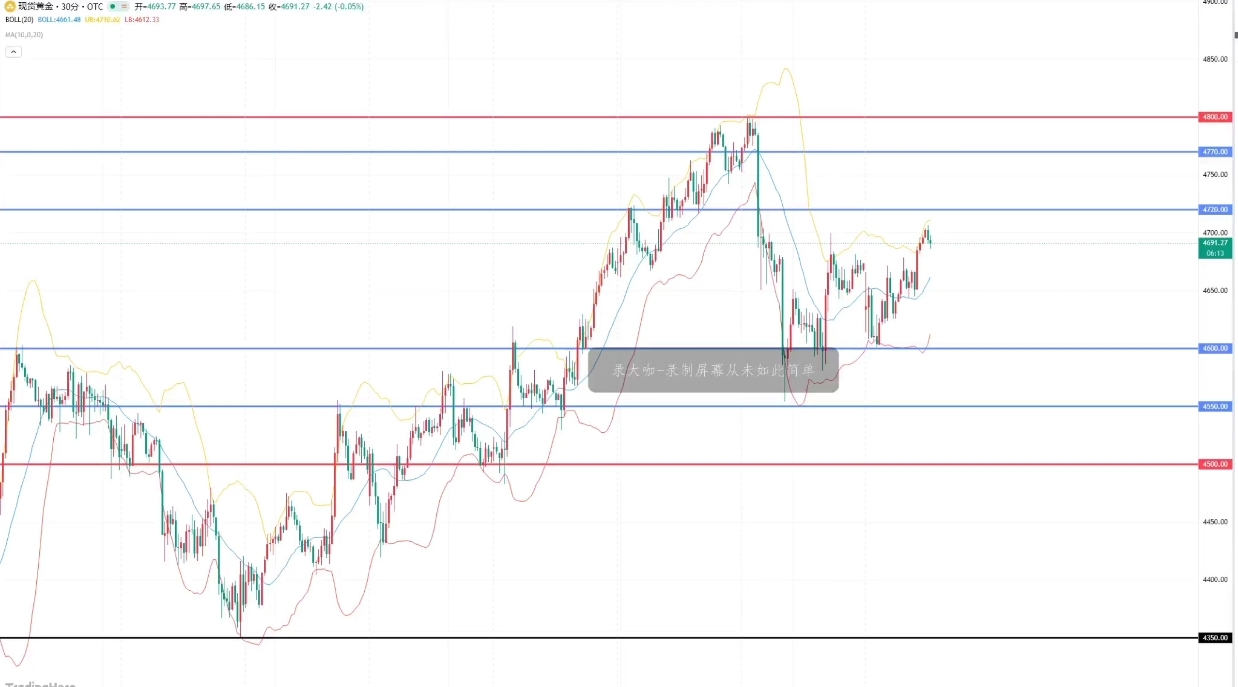
From the daily perspective, the previous continuous rise was interrupted by a large bearish candle, and now there is a continuous decline breaking below the middle band of the Bollinger Bands. Gold has weakened again; if it continues to be weak, it will test the previous low points. This week, we will follow the weak trend and look for a decline. The 4-hour chart shows a fluctuating market, with the Bollinger Bands closing and moving averages converging, indicating no clear directional trend. There is resistance at 4800 above and support at 4500 below. Before breaking through this range, we will trade within the fluctuations. If it breaks out, we will follow the direction. On the hourly chart, the week starts with fluctuations, with resistance at 4700 above. If we stay above 4700, there may be sudden news affecting the market in the first half of the week; below, we will first look at 4570-4550. If it breaks down, the adjustment will accelerate. In terms of operations, we will wait to try short positions in batches near 4700 above, with a manual stop loss above 4720. The target is to look down around 4580-50. Overall, today's short-term trading strategy for gold is to mainly focus on buying on dips and selling on rebounds. The key resistance above is at 4720-4770, and the key support below is at 4640-4600.
Latest trend analysis of crude oil:
On Monday morning during the European session, U.S. crude oil fluctuated around $109.42 per barrel. Trump has threatened to strike Iranian facilities again, and Iran has not backed down. Last Thursday, oil prices soared, with U.S. crude rising more than 11% in a single day and Brent crude rising nearly 8%. This is mainly due to Trump's statement to continue attacking Iran, and the uncertainty regarding the opening time of the Strait of Hormuz.
Last week, crude oil initially fell to near the 10-day moving average. On Thursday, it surged significantly due to news, breaking the 108.5 pressure point, reaching a high of 113.9, and then slightly retracing, with the daily line closing as a large bullish candle. Over the weekend, the news did not improve, and today the market opened with a gap up to 115.3, but without more favorable support, it subsequently retraced to fill the gap. This week, the key for crude oil is whether it can hold the gains from last Thursday. Below, we will focus on the support levels at 100.5 and 109-108.5. If it holds, it will be a technical adjustment, and with further positive news, it could rise to 115 or even 120; if it cannot hold, it will continue to fluctuate and adjust, which will depend on changes in the news. Overall, today's trading strategy for crude oil is to mainly focus on buying on dips and selling on rebounds. The key resistance above is at 115.0-120.0, and the key support below is at 105.0-100.0.#黄金 $XAU