Latest gold market trend analysis
After the opening of the Wednesday Asian market, spot gold surged strongly, with the current price stabilizing above $4810 per ounce, a short-term increase of over 2%, as bulls strongly broke through the previous consolidation range. The core driver of this round of gold's rise is the continuous escalation of geopolitical tensions in the Middle East, with Iran firmly rejecting ceasefire proposals and increasing transit control in the Strait of Hormuz intensifying market risk aversion. Coupled with the ongoing cooling of expectations for interest rate cuts by the Federal Reserve, safe-haven buying has surged, driving gold prices to rise violently.
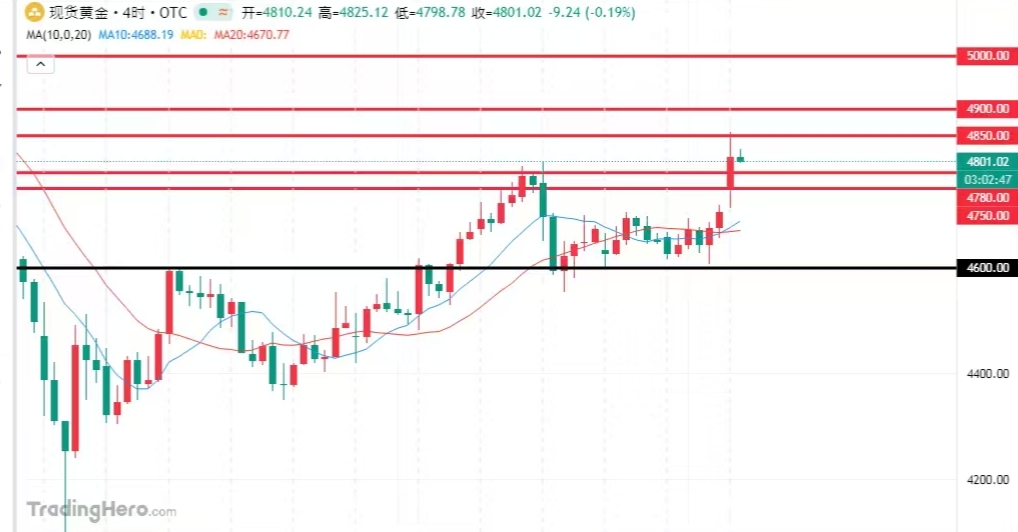
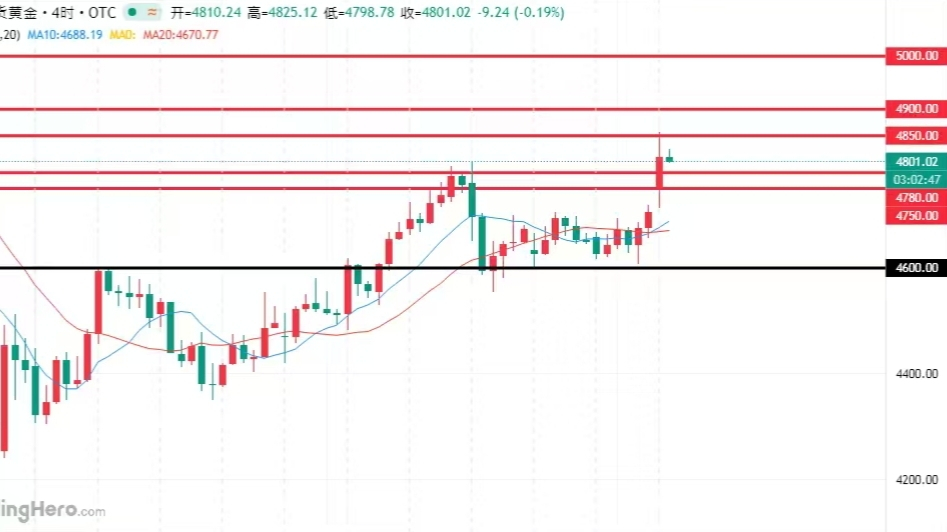
During the overnight US market session, gold prices started a one-sided rally from a low of 4607, reaching a peak near 4857, completely breaking the 4500-4800 consolidation pattern. The daily chart shows a strong bullish close, with moving averages in a bullish arrangement, establishing a medium-term bullish trend. The 4-hour chart shows a one-sided upward trend, with prices stabilizing above the MA5 and MA10 moving average supports. The MACD golden cross is expanding, and bullish momentum is sufficient, making any short-term pullback a buying opportunity.
Currently, after breaking through the large range, the upper space has opened up, with key attention on the resistance at the previous high of 4857; a breakthrough would target the 4900-5000 level. The lower support has moved up to the 4780-4750 range, which is the short-term dividing line between strength and weakness. Enter a long position when it falls back to around 4780-4790, with a manual stop-loss below 4760, targeting 4850-4880, and hold for above 4900 after a breakthrough. Overall, today, in terms of short-term gold trading strategy, Lao Yu suggests focusing on buying on dips primarily, with selling on rebounds as a supplement, paying close attention to the short-term resistance at 4850-4900 above and the short-term support at 4780-4750 below.
Latest trend analysis of crude oil
After the Wednesday Asia session opened, WTI crude oil experienced a cliff-like plunge, with prices plummeting from a high of 109.25 to a low of 91.23, a one-day decline of over 12%, completely reversing the previous bullish trend. The core driver of this round of crude oil collapse is the signals of easing geopolitical tensions in the Middle East, leading to a concentrated retreat of the previously overvalued supply risks, coupled with a frantic exit of profit-taking, triggering a short-seller stampede.
From the market perspective, after breaking through the key support of 110, crude oil accelerated its decline, with moving averages in a bearish arrangement, the 4-hour chart showing a one-sided downward trend, MACD death cross expanding, with strong bearish momentum, and a clear short-term weakness. Currently, the price is briefly stabilizing around 96, representing a weak rebound after an oversold situation, not a reversal signal.
The upper resistance has moved down to the 100-102 range, which is the short-term dividing line between strength and weakness; the lower support to watch is at the 91-90 level, if broken, it would target the 88-85 area. Overall, today, in terms of short-term crude oil trading strategy, Lao Yu suggests focusing on selling on rebounds primarily, with buying on dips as a supplement, paying close attention to the short-term resistance at 99.0-102.0 above and the short-term support at 91.0-90.0 below.