 Asset: BNB/USDT
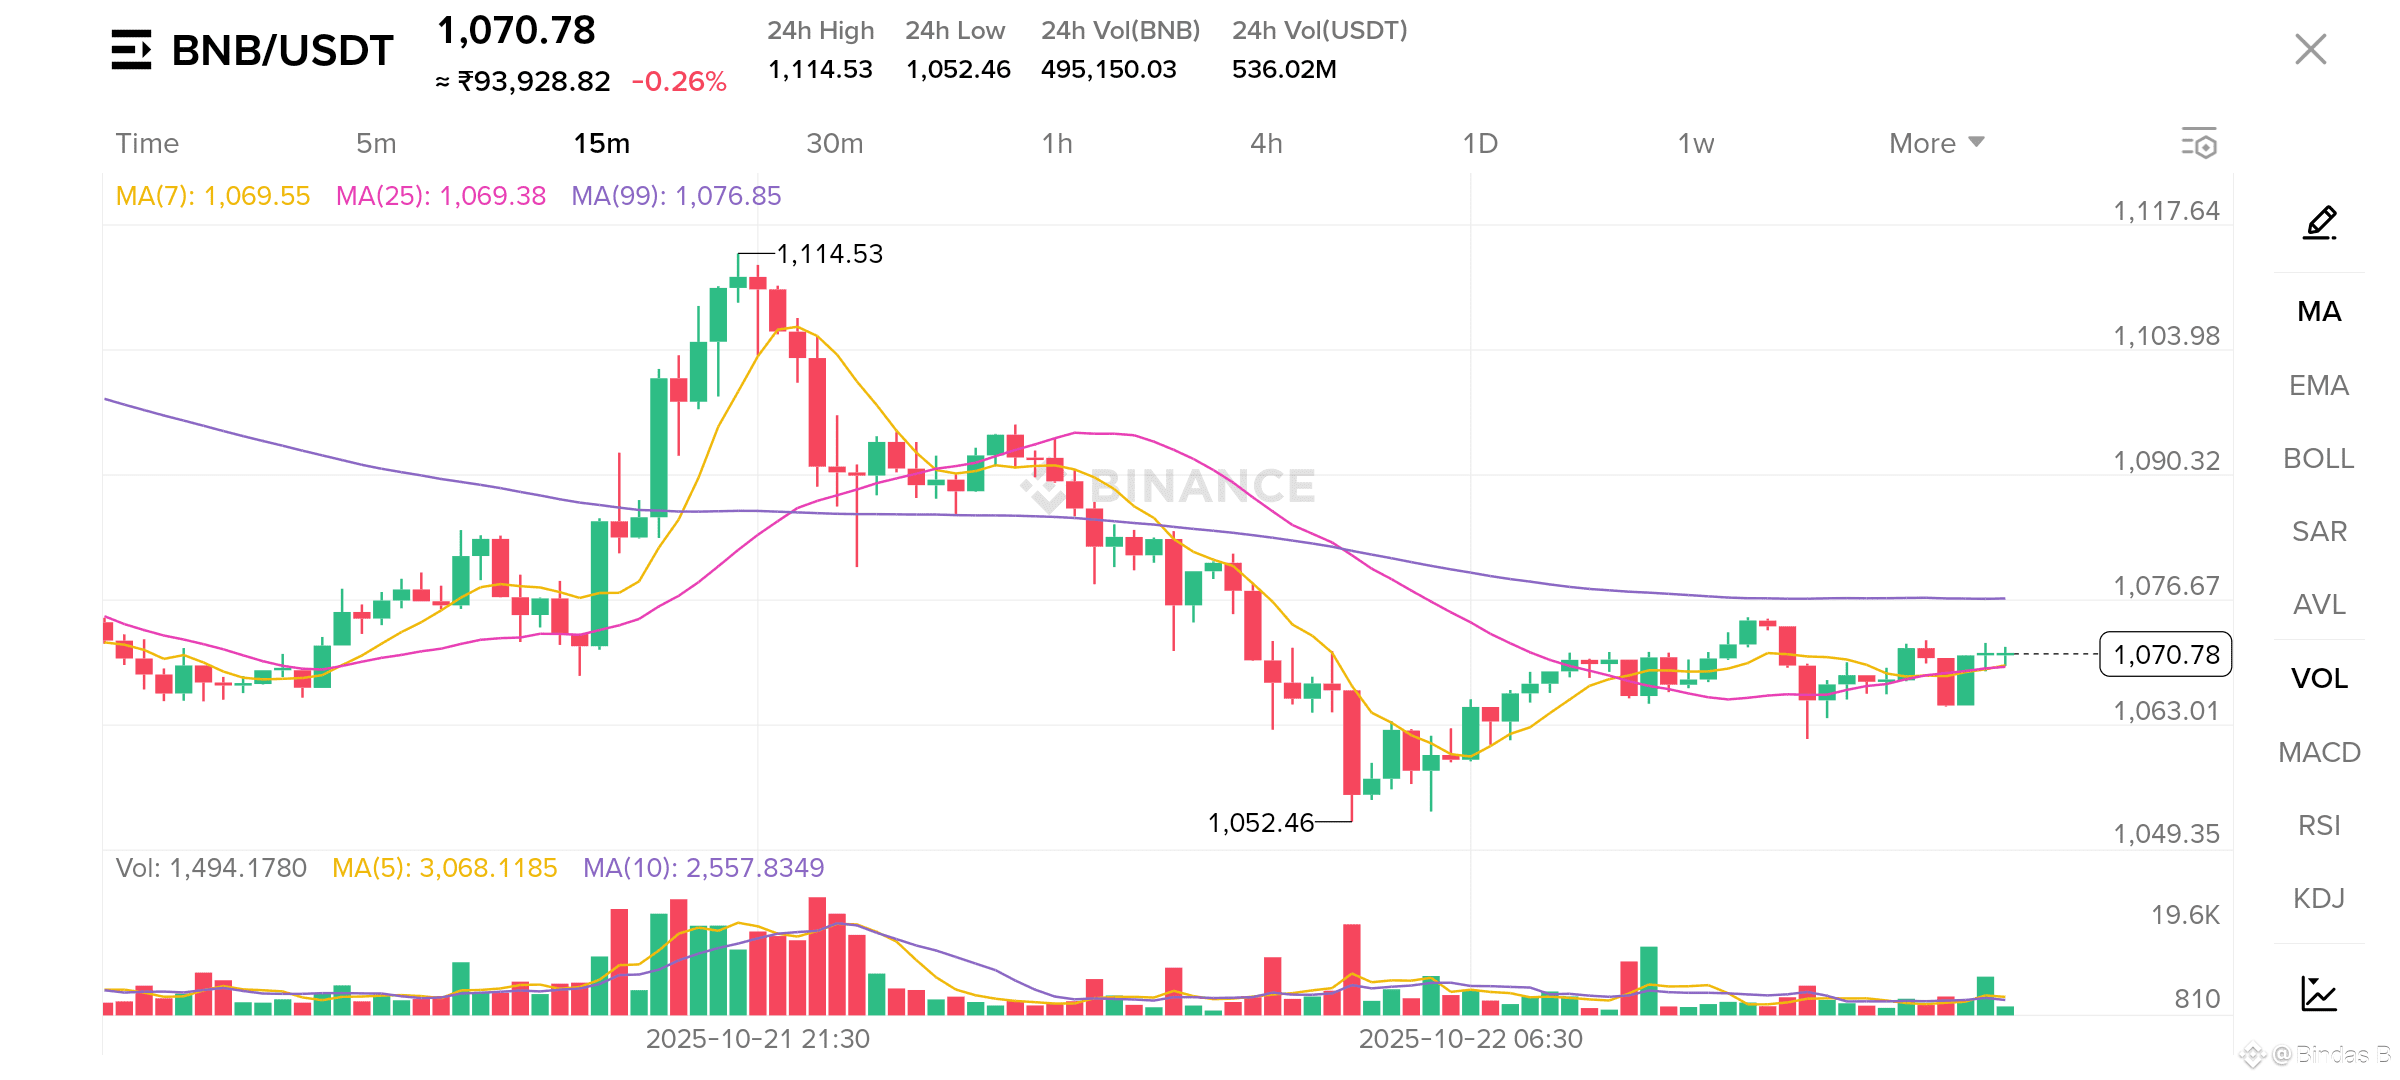
Current Price: 1,070.78
Timeframe: 15-Minute Chart
This article provides short-term technical analysis based on the 15-minute chart, intended for intraday traders and scalpers.
Analysis of the Current Market
The BNB/USDT pair has experienced significant volatility over the last 24 hours, trading between a high of $1,114.53 and a low of $1,052.46. After a sharp sell-off from the peak, the price has entered a period of tight consolidation and is currently trading at $1,070.78.
Traders are now in a "wait and see" mode as the price is being squeezed between key moving average (MA) levels.
Key Technical Indicators
Price Action: The chart shows a strong rally to $1,114.53, followed by a sharp rejection and downtrend that found support at $1,052.46. The market is now in a slight recovery/consolidation phase from that low.
Moving Averages (MA):
The price is currently battling a key resistance level: the 99-period MA (purple line) at approximately $1,076.85. This level has capped the price in recent candles.
Immediate support is being provided by the clustered 7-period MA (yellow line) and 25-period MA (pink line), both hovering around $1,069.40.
Volume: The volume bars at the bottom are notably low, trading well below their 5-period and 10-period moving averages. This "drying up" of volume during a consolidation phase signals trader indecision and often precedes a sharp, volatile breakout.
Intel for Traders: Key Scenarios
The current price action presents two clear, short-term scenarios. The market is coiled, and a breakout in either direction is likely.
Bullish Scenario 🐂
Trigger: A decisive 15-minute candle close above the MA(99) resistance at $1,076.85.
Confirmation: The breakout must be accompanied by a significant increase in volume to confirm buyer conviction.
Potential Targets:
$1,085 (Minor resistance)
$1,100 (Psychological level)
$1,114.53 (Retest of the recent high)
Bearish Scenario 🐻
Trigger: A decisive 15-minute candle close below the MA(7)/MA(25) support cluster at $1,069.40.
Confirmation: This breakdown should be supported by a spike in selling volume.
Potential Targets:
$1,052.46 (Retest of the recent low)
$1,040 (If the low is broken)
Conclusion
BNB is currently in a "squeeze" on the 15-minute chart, caught between immediate support around $1,069 and primary resistance at $1,077. The low volume suggests a significant move is imminent. Traders should avoid taking positions within this tight range and instead wait for a confirmed, high-volume breakout in either direction.
#BinanceHODLerTURTLE #BinanceHODLerZBT $BNB
