Good morning, Trading Warriors! 🛡️
While most are distracted counting pennies or panicking over the news noise, we take a moment to read the only language that can't lie: the price and volume.
The market just threw us a litmus test at $78,000. Many see just a simple green candlestick; I see massive wealth transfer happening in real-time. The whales have tried to shake the tree, but the institutions have built a fortified base that’s changing the game for 2026.
1. The Analysis of the Last 3 Candles (Price Action)
Daily Timeframe (1D): The Absorption Momentum
Candlestick 1 (Rejection): We saw an attempt to break $78,333 that ended in a long upper wick. The whales released liquidity to test demand strength.
Candlestick 2 (Consolidation): A small-bodied candle that perfectly respected the EMA 9 (Yellow). This is where the institutions 'got involved' to prevent the price from breaking below $74,000.
Candlestick 3 (Current - Breakout in process): We're seeing a solid green candle surpassing $78,176. Attention! We're breaking the previous high. If we close the day like this, the path to $82,000 is clear.
Monthly Timeframe (1M): The Great Recovery
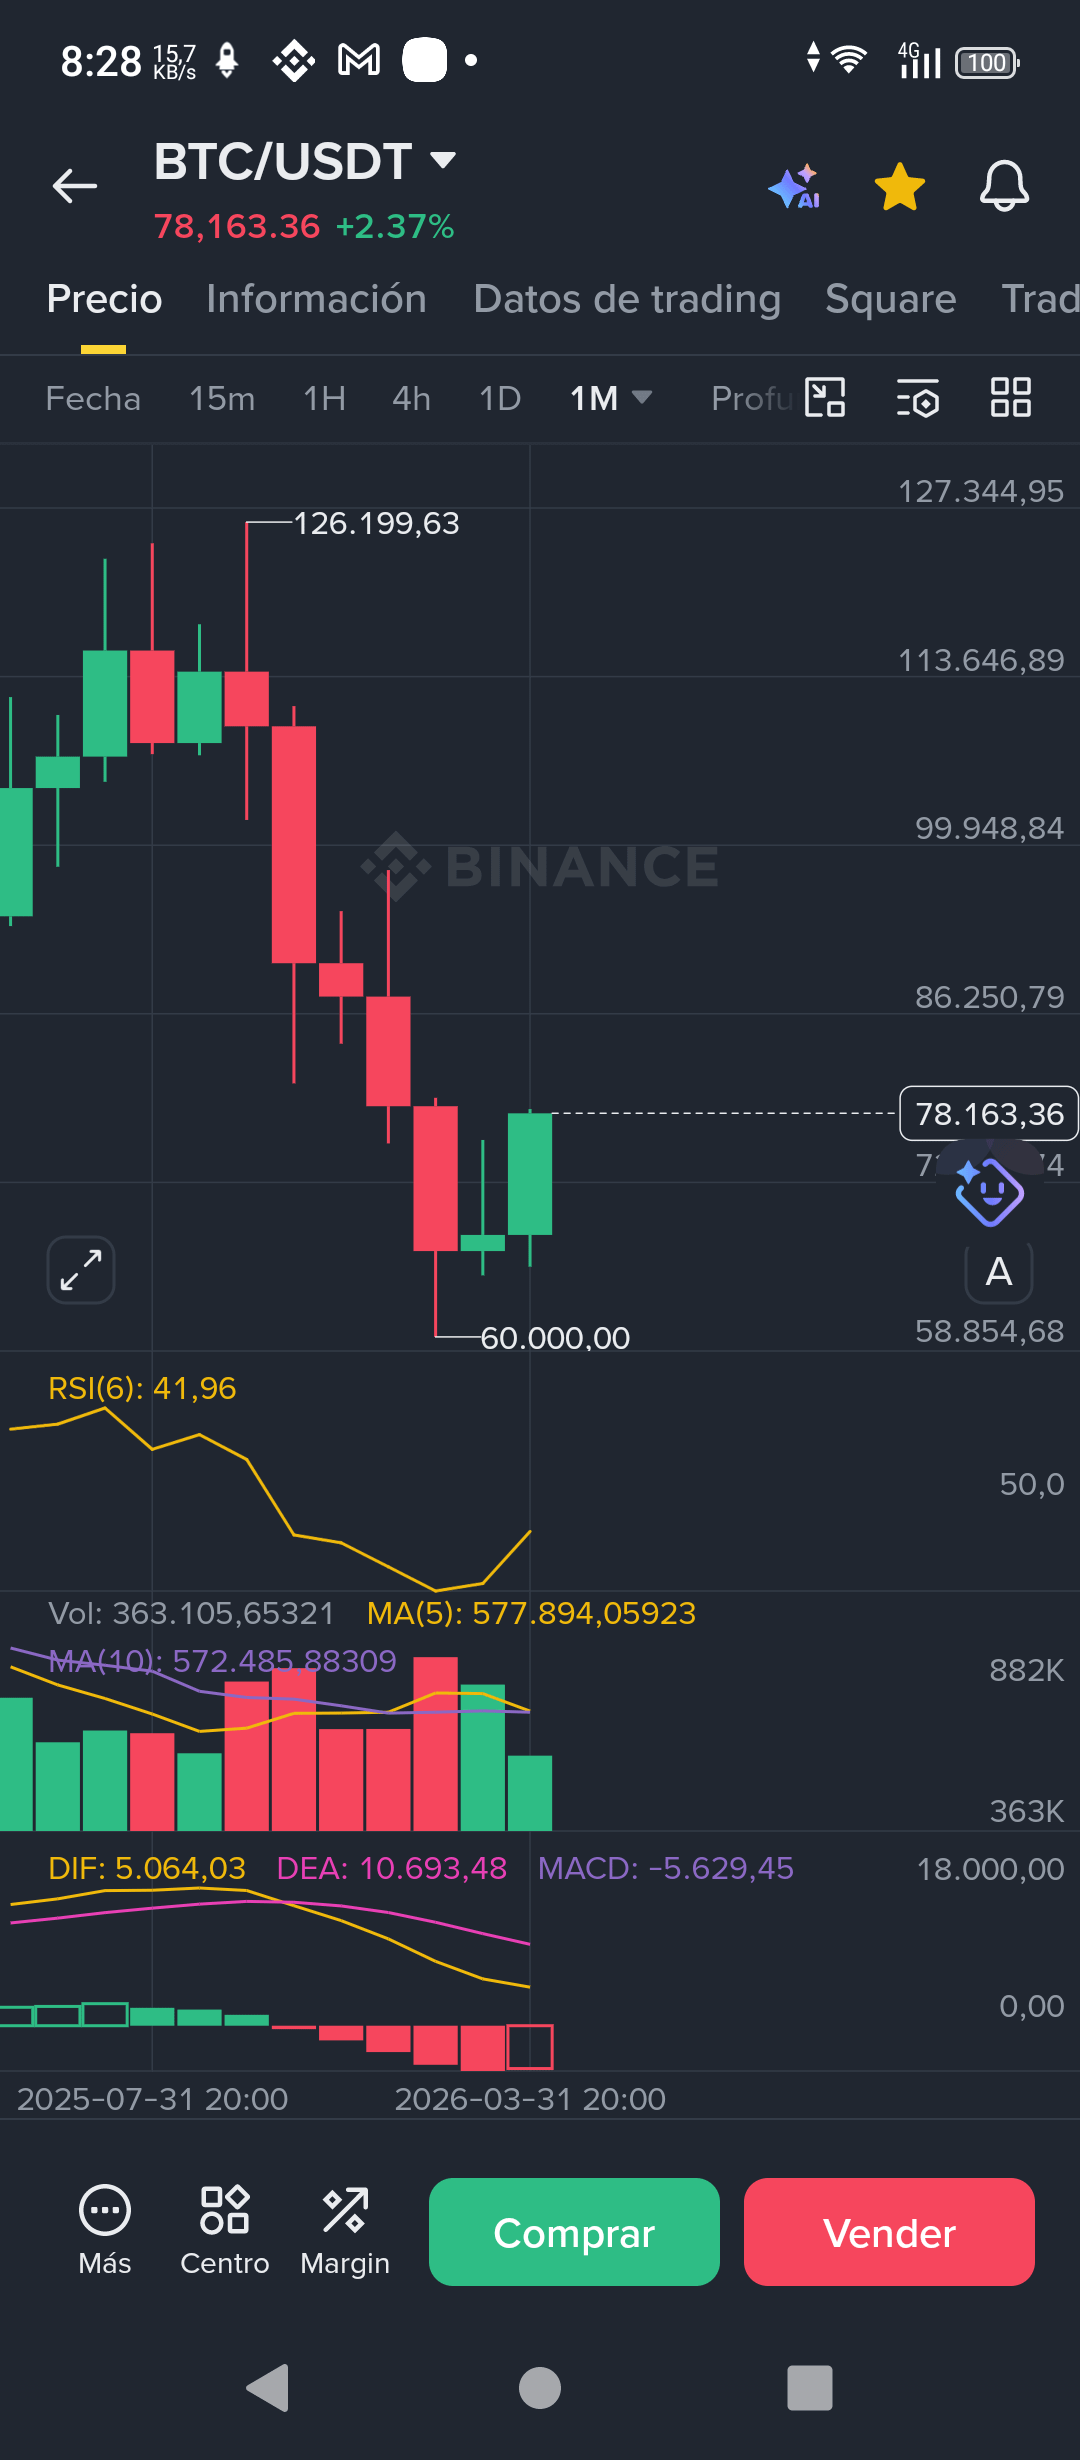
The last 3 monthly candles show a 'V-Shape' recovery from $60,000. The current candle is engulfing resistance at $76,000, indicating that the macro sentiment is shifting from bearish to accumulation-aggressive.
2. What the MACD tells us (The engine of movement)
In 1D: The MACD is in a desirable position. The DIF (1,906) is distancing itself from the DEA (1,484) with an upward slope. The histogram shows increasingly taller green bars (422.14).
Reading: There is real bullish momentum. This isn't a false bounce; there's volume and conviction behind it.
In 1M: Although the macro MACD remains negative (-5,629), the red histogram is shrinking drastically.
Reading: The 'pain' is ending. We're close to a macro bullish cross that could define the rest of 2026.
3. Detailed Signals and Whale Action
RSI (1D) at 71.73: We're entering overbought territory. Heads up: Whales often cause a little shakeout when the RSI crosses 70 to liquidate those who enter late with high leverage.

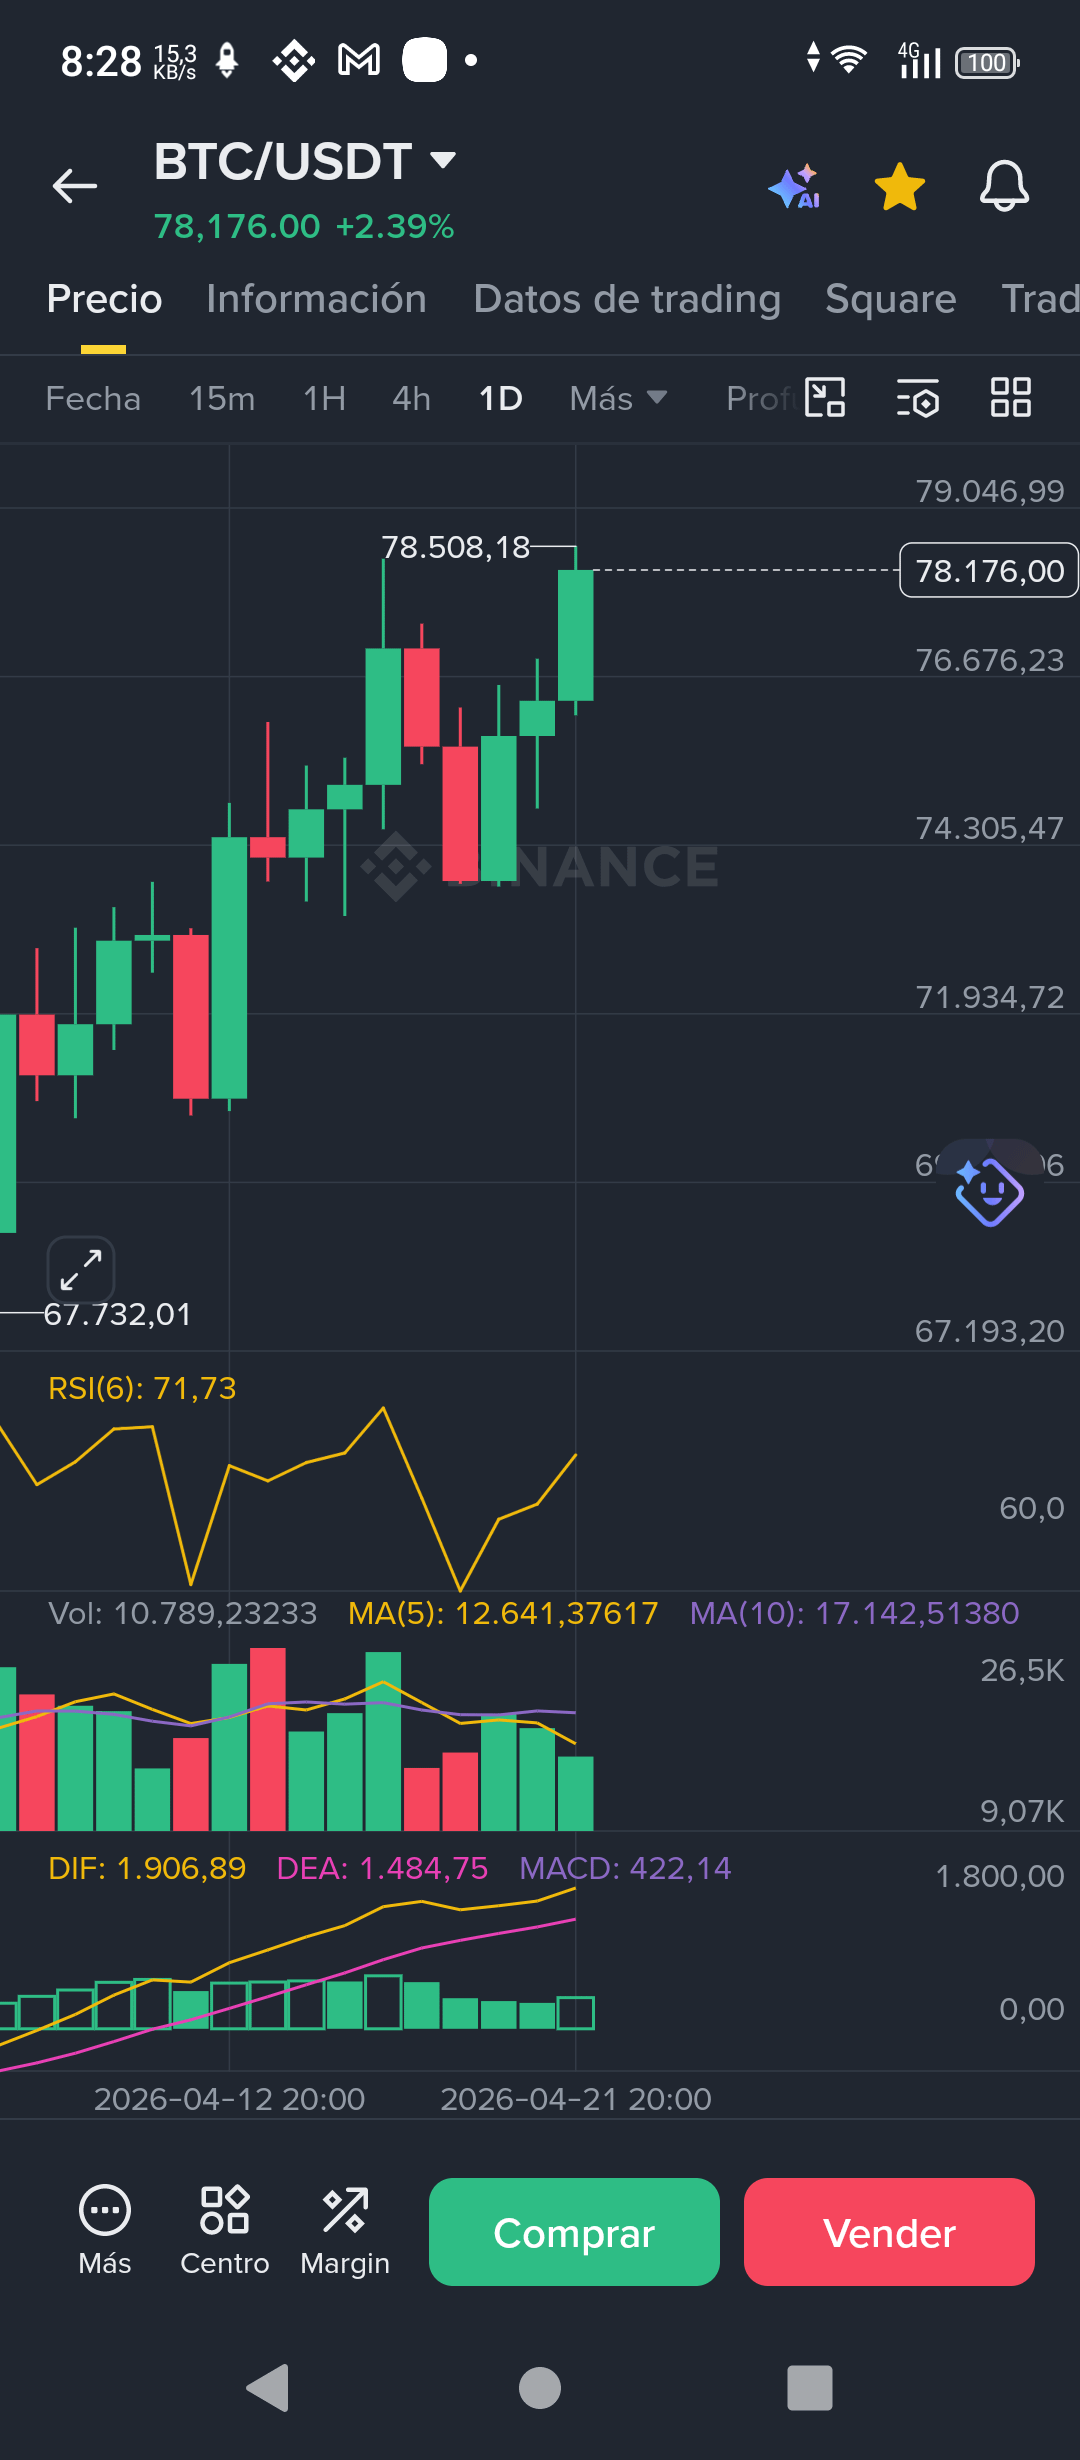
 Institutional Action: The support in the yellow and purple EMA zones is solid as granite. Every time we touch the EMA 9, there are massive institutional buy orders.
4. Next Play: How to act?
If you're already in: Stay calm. Raise your Stop Loss to the $74,500 zone (protecting profits below the EMA 9).
If you're looking to enter now: Don't chase the price at the top of the candlestick. Wait for a retest of the previous breakout zone ($76,500 - $77,000). Entering at $78k with the RSI at 71 is risky for a short trade.
The Warrior's Vision: The technical target is $82,715 (EMA 200). That's where whales will take strong profits. Be ready to sell a part there.
💬 Key question:
"We're breaking $78,500 with a daily MACD loaded with gunpowder... 🚀 Do you think the whales will let us reach $85,000 without another scare drop, or have the institutions already taken full control of the ship? Let me know your thoughts below! 👇"
Nexo Analysis: Tracking the trail, securing the win.