The day before yesterday, international gold prices surged strongly, gaining momentum like a rolling snowball. In just two months, it consecutively broke through several important integer thresholds. London spot gold reached a high of $4380/ounce, while New York futures gold peaked at $4392/ounce.
However, as international gold prices reached historical highs, the risk of technical overbought conditions accumulated, and market volatility significantly intensified, with rapid pullbacks occurring multiple times during the session. On October 17, international gold prices fell across the board, with London spot gold dropping $75.03 in a single day, a decrease of 1.73%; New York futures gold decreased by $36.7, a drop of 0.85%.
There is no asset in the world that only rises without falling, and gold is no exception. Historically, gold has experienced two major bull markets at the 10-year level, occurring in the 1970s and in the 2000s.
As the current gold market transitions from a state of high enthusiasm to a phase of consolidation, we can take this opportunity to review historical patterns and examine two key questions: What usually leads to the end of a major bull market in gold? What kind of pullback risks might be faced in the short term?
One
How will the first major bull market in gold end?
The first major bull market in gold began in 1968, with the price of London spot gold starting at $35 per ounce and continuously rising, reaching a historical peak of $850 per ounce in 1980, with a cumulative increase as high as 2328.57%. However, after reaching this high point, the gold price quickly fell, closing that month at $653 per ounce, with the monthly increase narrowing from 51.92% to 27.54%.
Afterward, although the gold price experienced stage rebounds in February 1983 and December 1987, reaching $509.25 per ounce and $499.75 per ounce respectively, it remained in a long-term downward channel overall during the twenty years from 1980 to 2000. By August 1999, the price of London spot gold had dropped to a minimum of $251.95 per ounce, a decline of 70.36% from the historical high of $850 per ounce.
Gold entered a bull market in 1968, primarily due to the fact that the Bretton Woods system centered around the dollar was no longer sustainable. Although President Nixon announced the cessation of the dollar's convertibility into gold, the inherent problems of the dollar system have not been fundamentally resolved.
The credibility of the dollar is essentially a reflection of the national credibility of the United States, which was previously backed by the U.S.'s massive gold reserves and has since been transformed to rely on the comprehensive national power of the United States as a guarantee after decoupling.
However, at that time, the U.S. faced multiple dilemmas, such as rising fiscal deficits, economic stagnation, escalating inflation, and high unemployment rates, which severely weakened global confidence in the dollar and the U.S., leading investors to allocate gold to avoid currency risk.
Until August 1979, Paul Volcker, known for his tough stance, took office as the Chairman of the Federal Reserve, quickly raising the federal funds rate and implementing extremely tight monetary policies to address the increasingly severe problem of high inflation.
At that time, international gold prices fell synchronously, showing a significant negative correlation with interest rates. Subsequently, President Reagan pushed for neoliberal reforms marked by 'Reaganomics,' gradually resolving the stagflation problem that had plagued the United States for years and restoring global confidence in the U.S. economy and the dollar. Therefore, although the subsequent gold prices experienced a temporary surge due to various factors, they failed to break through the historical peak of $850 per ounce set in January 1980.
With the rise of the third industrial revolution represented by internet technology, the United States, as the dominant country, gained huge growth dividends, further suppressing the price of gold, which is the opposite of the dollar's credit. By 1999, at the peak of the internet revolution, the gold price had dropped to a minimum of $251.95 per ounce.
It can be seen that the termination of the first major bull market in gold was directly induced by liquidity tightening, while a fundamental improvement in the U.S. economy was the decisive factor.
Two
How will the second major bull market in gold end?
The second major bull market in gold began in 2001, with London spot gold starting its upward trend from $272.50 per ounce and reaching a historical peak of $1921.15 per ounce in 2011, with a cumulative increase of 605.01%.
However, similar to the previous bull market, the gold price quickly entered a deep adjustment after reaching a new high, dropping from the peak by $388.43 to $1532.72 per ounce that month, with the monthly increase shifting from an increase of 5.25% to a decrease of 11.05%.
In the subsequent months, the gold price attempted to rebound multiple times, reaching $1802.93 per ounce, $1790.75 per ounce, and $1796.10 per ounce in November 2011, February 2012, and October 2012, respectively, but overall still struggled to reverse the downward trend. By December 2015, the gold price dropped to a minimum of $1045.54 per ounce, the lowest level since 2010, down 45.58% from the peak of $1921.15 per ounce. The gold price has not fallen below this position since.
After the burst of the internet bubble in 2001, the U.S. economy suffered a severe blow, and the Federal Reserve lowered the federal funds rate to a historic low of 1% to stimulate the recovery of the U.S. economy. At the same time, the U.S.'s long-term external expansion consumed a large amount of national power, and the rise of emerging economies such as China showed a downward trend in its global relative strength.
Gold once again became an important asset to hedge against the credit risk of the dollar, especially driven by countries like China that are increasing their gold reserves, with prices continuously rising since 2001, entering a sustained upward channel.
By the time the subprime mortgage crisis broke out in 2007, rapidly spreading globally, gold, as the ultimate means of payment and safe-haven asset, saw its price soar. Although there was a temporary pullback in 2008 due to market liquidity tightening, it did not change its long-term upward trend. The outbreak of the European debt crisis in 2009 continued to strengthen gold's safe-haven attributes, further extending the second major bull market in gold.
Even before the full outbreak of the subprime mortgage crisis, then-Federal Reserve Chairman Ben Bernanke had already initiated the rate-cutting cycle in September 2007, reducing the rate by 2.75 percentage points to 2% within less than a year. To respond to the unprecedented economic and financial crisis, the Federal Reserve further increased its easing efforts, not only lowering the federal funds rate to the zero lower bound but also successively launching unconventional monetary policies such as quantitative easing and forward guidance, guiding long-term rates to continue declining.
It was not until the second half of 2009 that the impact of the subprime mortgage crisis began to weaken, and the U.S. economy started to enter a recovery phase. However, the growth rebound during this stage was partly driven by the low base effect and more reflected a recovery in the growth rate. At this time, the unemployment rate remained high, indicating that the foundation for recovery was still unstable.
The Federal Reserve launched the second and third rounds of quantitative easing in 2010 and 2012, respectively, which also confirmed its cautious attitude toward the economic outlook. In fact, the U.S. per capita GDP only returned to the 2008 level in 2011, completely eliminating the adverse effects brought about by the subprime mortgage crisis.
It is worth noting that when the second major bull market in gold peaked in 2011, the Federal Reserve was still in the second round of quantitative easing, and the third round had not yet been initiated. Its asset purchase program did not fully exit until October 2014, and the raising of the federal funds rate did not occur until December 2015.
This indicates that the end of the gold bull market was not directly caused by a substantial tightening of liquidity. However, at that time, as the U.S. economy gradually warmed, there were indeed market expectations that liquidity would tighten. The end of the second major bull market in gold was driven by the potential tightening of liquidity, while a fundamental improvement in the U.S. economy remained the decisive factor.
Three
How will this round of the gold bull market end?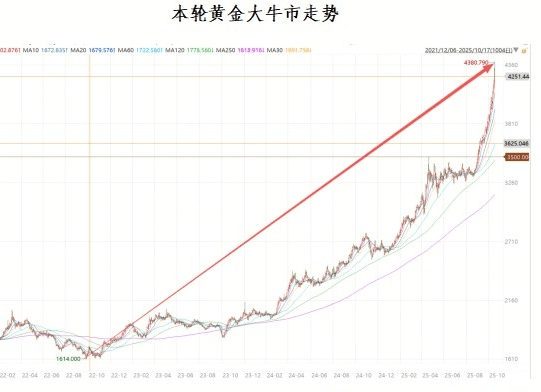
This round of the gold bull market began in 2022, with London spot gold starting its upward trend from $1614 per ounce, reaching a maximum of $4380.79 per ounce, with a cumulative increase of 171.42% during this period, yet still far below the peak levels of the previous two bull markets. Although gold has seen some recent pullbacks, the overall upward trend remains unchanged. Considering that the current upward momentum has not yet diminished, further upward space is expected in the future.
In the current environment, the core logic supporting the initiation of the third major bull market in gold is similar to that of the first and second bull markets, still rooted in the continuous weakening of global trust in the United States and the dollar system.
Specifically, the main driving factors include the following three aspects: First, the U.S. fiscal deficit has remained high for a long time, and government debt has continued to expand, leading to widespread market concerns about its debt sustainability; Second, the U.S. government has continuously pressured the Federal Reserve to promote early interest rate cuts, which has weakened market confidence in the Fed's policy independence; Third, the function of the dollar as an international reserve asset has been frequently politicized, with multiple countries actively increasing their gold holdings to enhance the safety and independence of reserve assets to avoid potential asset freeze risks.
To rebuild global confidence in the United States and the dollar, the key lies in promoting a fundamental improvement in the U.S. economy and re-establishing its leading position globally based on that. Considering that a large amount of U.S. industry has relocated abroad, comprehensive 're-industrialization' is unrealistic, and artificial intelligence may therefore become the key to breaking the deadlock.
On one hand, as the core technology of the Fourth Industrial Revolution, artificial intelligence is expected to inject new momentum into multiple industries, systematically enhancing total factor productivity, thus increasing the potential growth rate of the U.S. economy in the medium to long term, while widespread investment in artificial intelligence will also effectively boost the economy in the short term;
On the other hand, the United States has established a significant overall advantage in this wave of artificial intelligence, leading in hardware, software, and ecological aspects, with a number of globally influential companies such as NVIDIA, Oracle, and OpenAI, which means that the U.S. is likely to continue to obtain high technological premiums and monopolistic profits due to its leading position in the field of artificial intelligence, thereby consolidating its dominance in the global political, economic, and military landscape.
However, current artificial intelligence technology has not yet achieved large-scale deployment, and leading companies such as OpenAI still face huge losses, with its growth potential yet to translate into actual profits. Referring to the development history of internet technology, artificial intelligence is still in its early stages.
Therefore, the rebuilding of global confidence in the United States and the dollar is expected to be a long-term process. It is worth noting that we may currently be in the recession phase of the fifth Kondratiev wave cycle represented by information technology. This period is often accompanied by profound adjustments in the global political and economic landscape.
Because the crises and challenges facing the U.S. currently may exceed those of the 1970s. We believe that this round of the gold bull market has not yet reached its endpoint, and its price increase is likely to approach at least 605.01%, the lower limit of the second bull market, and is more likely to match the 2328.57% of the first bull market, with even the possibility of exceeding this level.
It should be noted that even during the major bull market cycle of gold, the price increases are not always smooth, often accompanied by volatility and periodic pullbacks.
When the slope of the gold price increase is too steep, one must be wary of the risk of a technical pullback. Historical trends show that gold usually exhibits a pulse-like rising characteristic, maintaining a sideways consolidation for most of the time, while significantly realizing gains in a few periods. In this process, the Federal Reserve's monetary policy direction, geopolitical conflicts, and other external factors may become triggering points for price adjustments.
Although the overbought state of technical indicators may persist for a while, reviewing previous rises reveals that a significant pullback is ultimately unavoidable. Therefore, as the market enters a high-level stage, it is not advisable to overly chase 'tail' profits; locking in profits in a timely manner is a prudent strategy.
