
Welcome to the Lab, traders! 🍏🦾🧪
The last few days have been a whirlwind — I'm running around, juggling so many tasks that I don’t know where to start, and it often feels like it’s all for nothing... 🐿️🎡 I barely have time for my own ‘X-ray’, but that’s just how it goes. However, it’s in these moments that I see I’ve grown true pros!
Our candidate for the Senior Lab Tech position @Miyuna — you're just brilliant! 👏🌟 While I'm busy, you've essentially become my eyes in the market. Your BTC dissection is top-notch! For those asking about the Liquidation Map — today I'm giving you this scalpel. ✂️🩸
🔍 WHERE TO LOOK FOR OUR MICROSCOPE? 🌐🕵️♂️
Since we only see part of the game on the exchange, we head to our 'extraction station' — Coinglass.
1️⃣ How to find it: Just type 'coinglass' into Google. The first link is ours. 🎯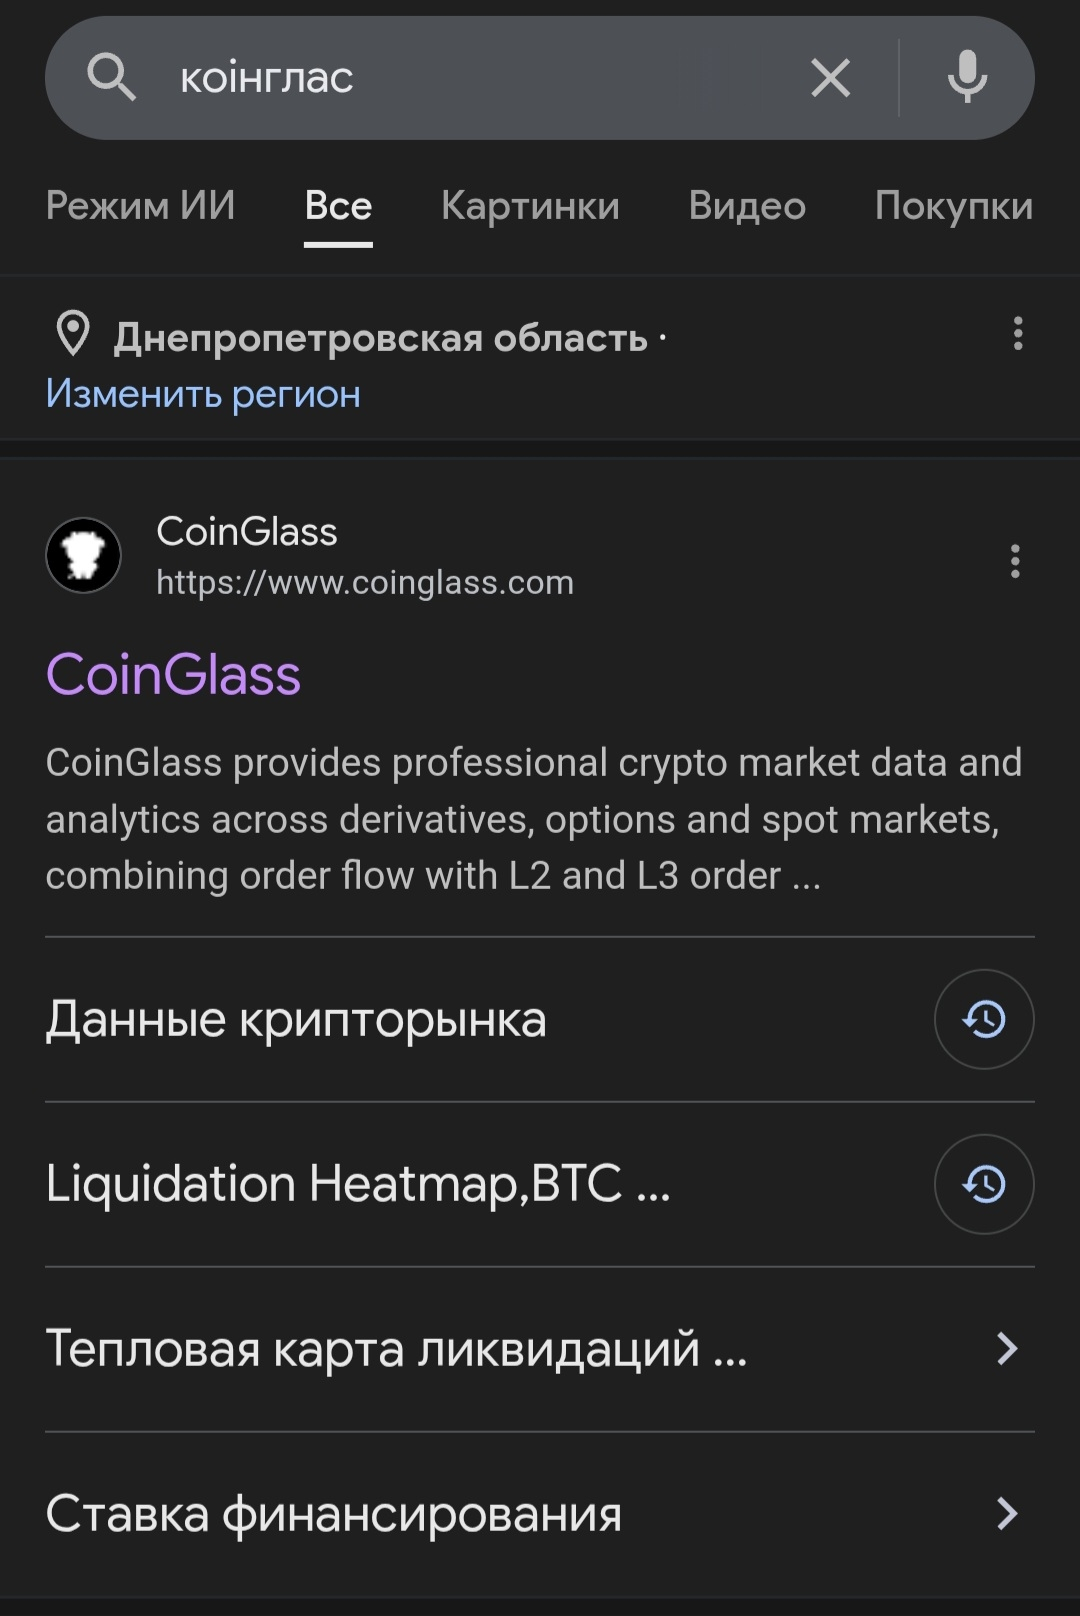
2️⃣ Settings: In the menu, select the 'Liquidation' section -> 'Liquidation Map'.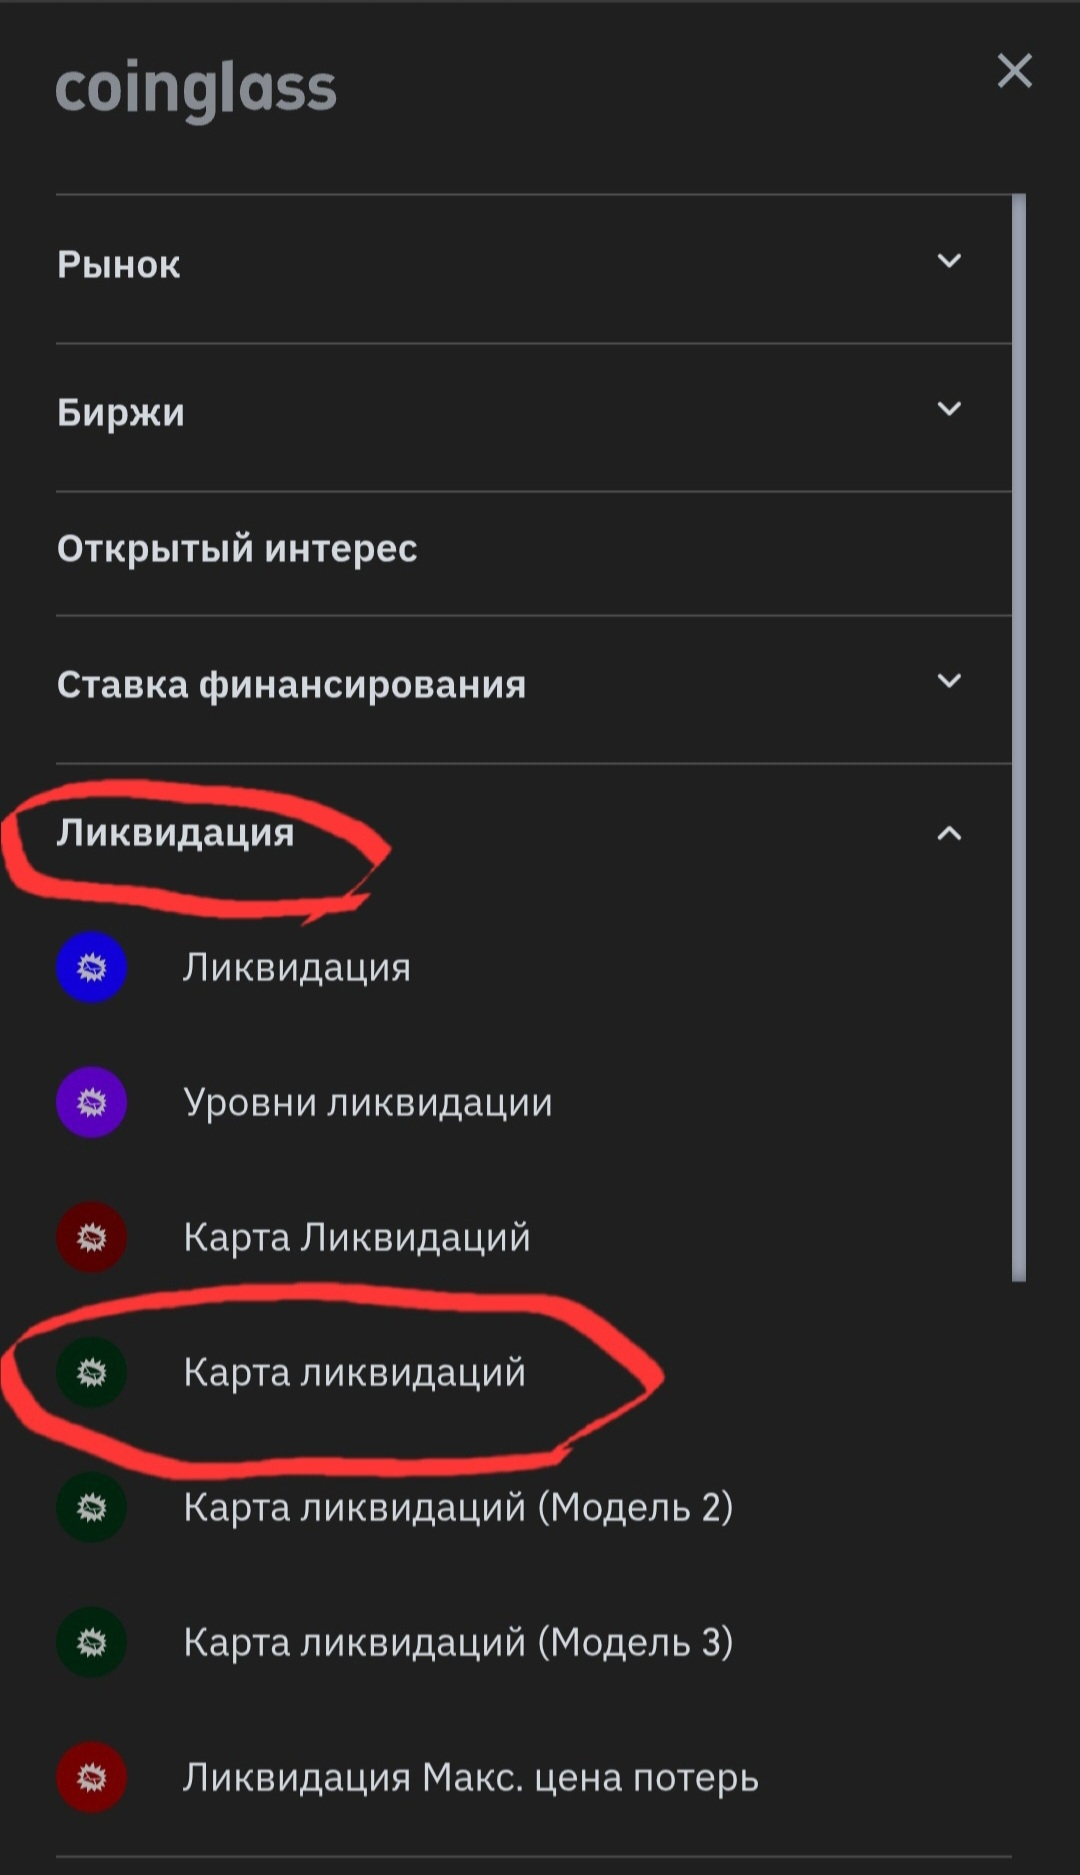
3️⃣ The main secret: Choose the 'Symbol' parameter.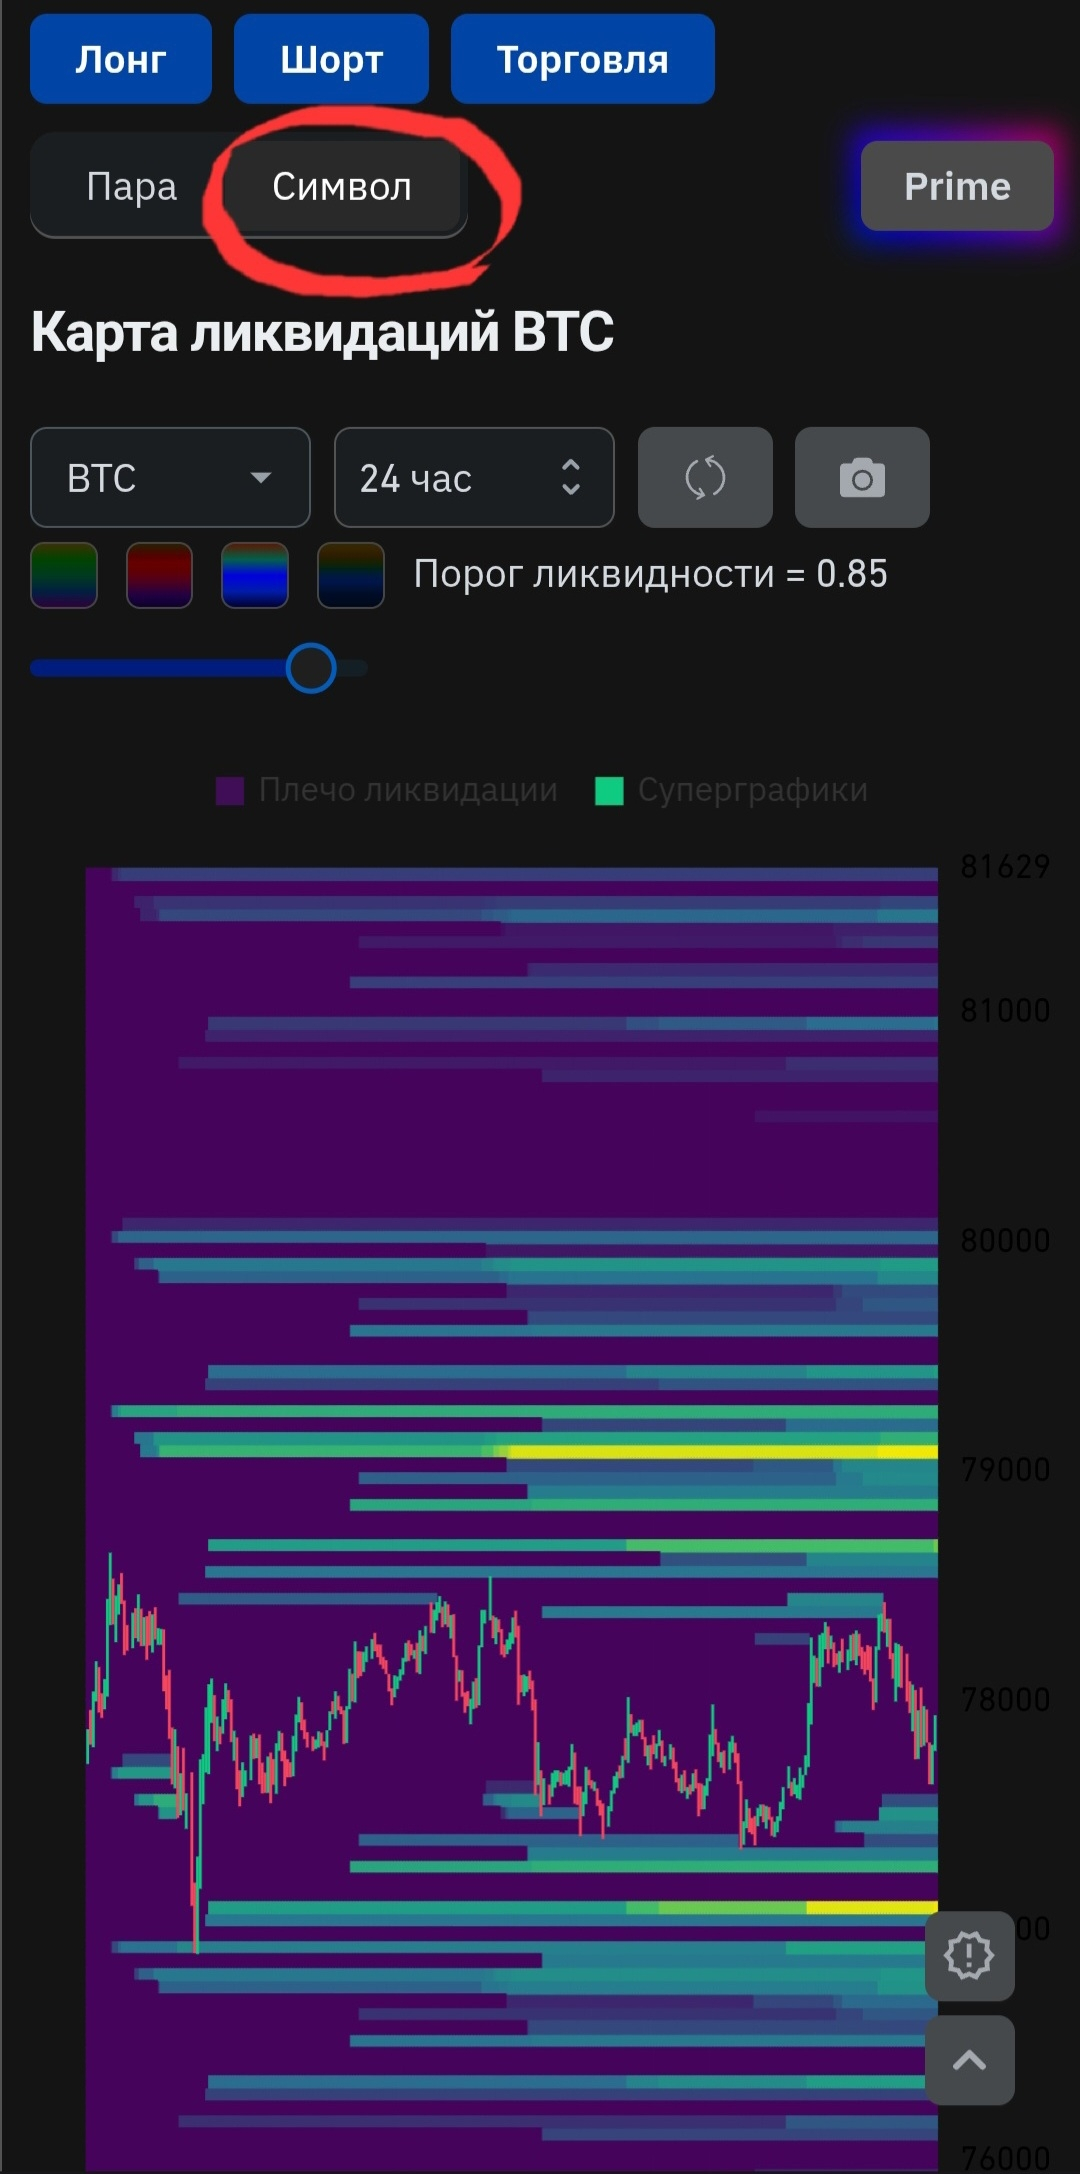
Why is that? Because the maker doesn't care about a single 'hive'. He sees the overall bloodbath worldwide. We're viewing the market through his eyes! 🐋👀💰
🧬 WHAT IS THE LIQUIDATION MAP? 🔬
If the regular price chart shows us the past, the Liquidation Map is a glimpse into the future. 🍎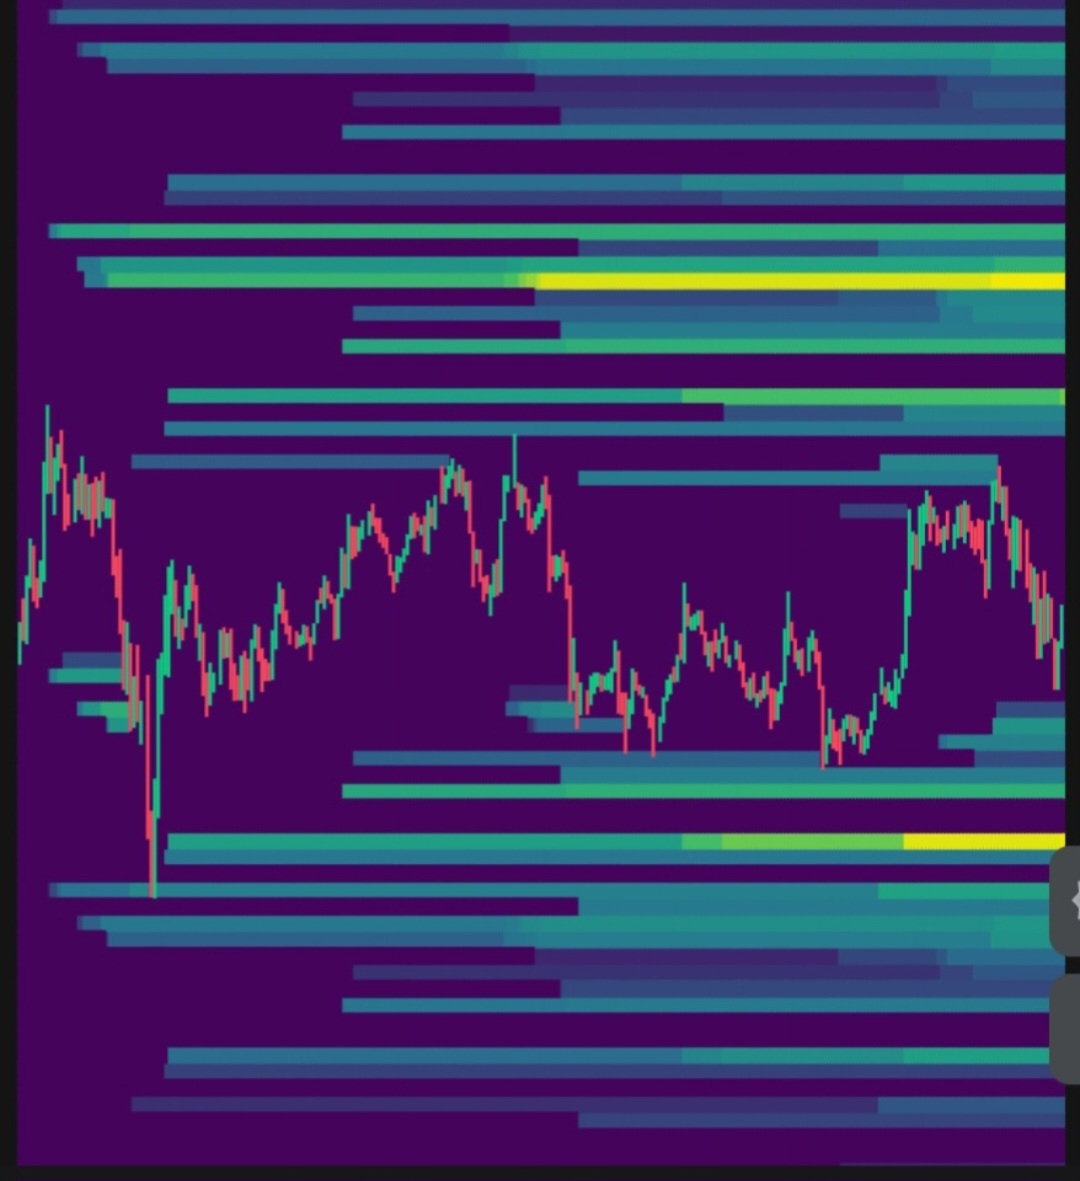
This is a visual model of where traders have critical points — levels at which their positions will be forcibly closed by the exchange.
When the price hits the bright line, thousands of positions 'explode', creating an avalanche of orders. 📈💥
For the maker, these zones represent a massive volume of free liquidity. It's advantageous for him to push the price there to 'reset' the crowd and, in turn, build his own position. 🐋⛽️
🎨 LANGUAGE OF COLORS: MARKET THERMAL IMAGER 🌈🌡️
The map works like a thermal imager. The 'hotter' the color, the more money is there:
1️⃣ Bright yellow / White: 🌕🌕🌕
GOLDEN APPLE. A critical mass of money. The main target of the maker. This is where the most powerful price explosions happen.
2️⃣ Light green / Salad: 🍏🔋
RIPENED APPLE. A very strong level. There's enough fuel here for a good impulse.
3️⃣ Green / Blue: 🌲💎
LOCAL ZONE. Average volumes. The maker can scoop them 'on the way', but not always does he change the trend for them.
4️⃣ Dark blue / Purple: 🌌🔮
EMPTY ZONE. There's almost no money here. The maker finds it 'unappetizing', he goes where the gold shines! 🦈💸
🩸 BTC DIAGNOSIS: DISSECTING TARGETS 🩺💎
My 'mini-computer' in my head has already calculated the moment's math for you: 🧠💻
⬆️ UPPER MAGNET (79,100): This is the real catch — $171 million worth of short blood! 📈💰 This magnet is much stronger.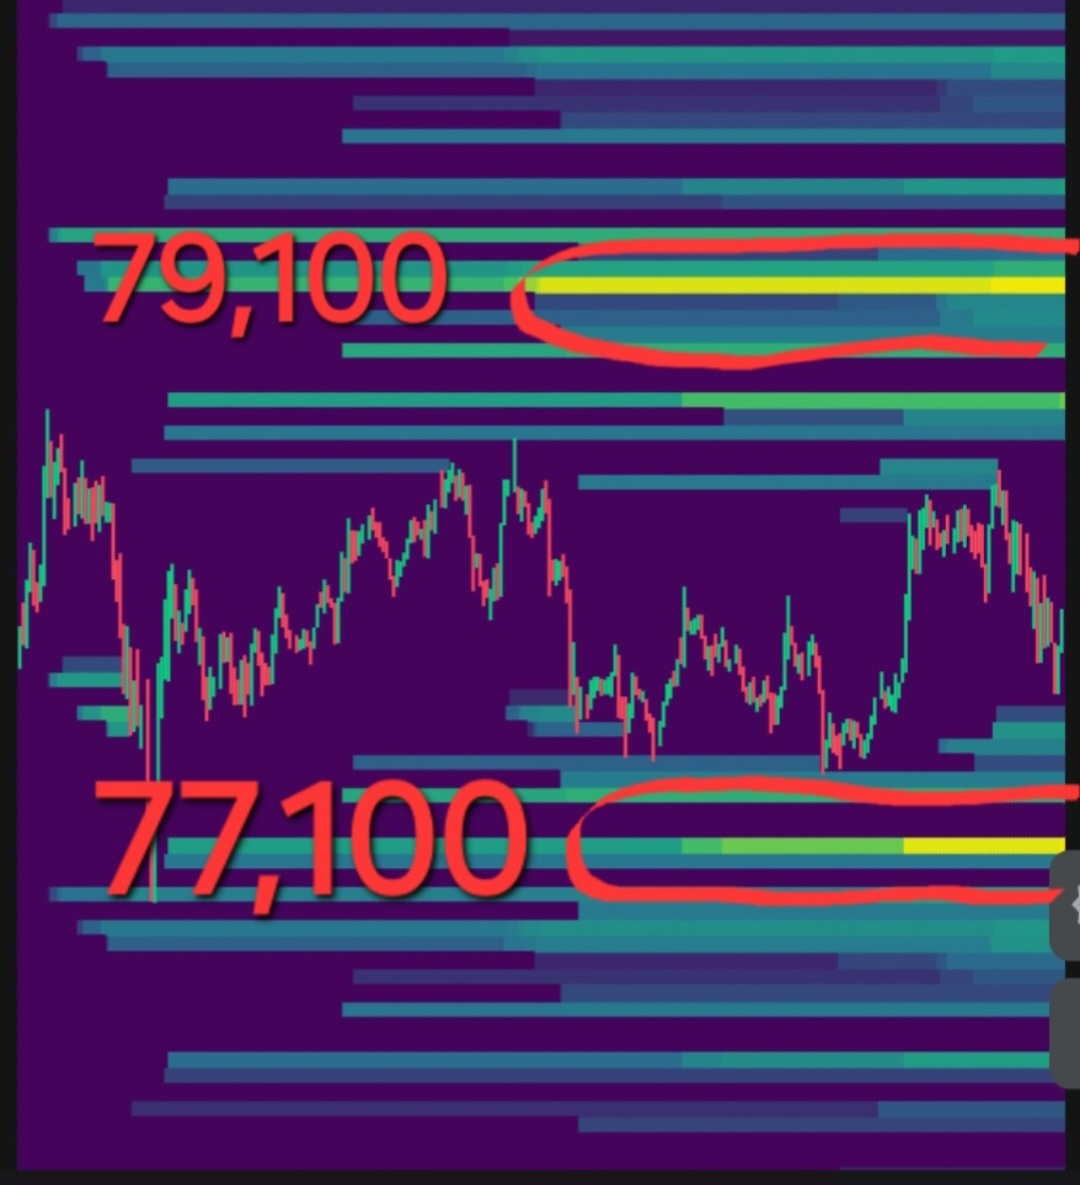
⬇️ LOWER TRAP (77,100): Here, $142 million worth of long liquidations are stacked. 📉🩸 The maker might give a little 'nudge' down to shave off this amount.
Diagnosis: It's more profitable for the maker to push the price UP. 🏹🚀 Often, a smaller zone (77,100) is gathered first to pivot and then rapidly penetrate the main target at 79,100. This is our Golden Apple. 🍎🌕
📝 TASK FOR ALL LAB TECHS: 📝🐝
Go to Coinglass, open the Liquidation Map for $ETH or $SOL (via 'Symbol').
@LITOMOLIG , @VikaArt , @IgViRk , @UA-MOBILA-UA , @Genius 753 , @Feed-Creatr 888 , @Miss Olya — the foundation is poured! 🧱💪🔬 I await your updated diagnoses in the comments:
Where is the brightest 'yellow' magnet located? 🧲
How many millions are 'loaded' there? 💵👇
With all this hustle and rush, I might have forgotten to mention something, so feel free to ask, don't be shy! 🙏 As soon as I have a free moment — I'll respond to everyone right away. Sorry for the inconvenience, we'll be back to normal rhythm soon! ⏳🙌
We don't guess — we see the intentions of the money! 😉💎🍎🦾
#BinanceSquare #MiniApple #BTC #liquidationmap #Darkness_777