Despite the Federal Reserve's expected interest rate cut on Wednesday, Bitcoin did not rise but instead fell, with the price once sliding to around $110,439, completely overturning the market's expectation of 'good news means a rise.' However, renowned analyst Crypto Birb went against the trend, listing 10 core indicators, believing this is exactly the calm before the storm, and Bitcoin is on the eve of a breakout.

1. Key moving average provides strong support, the foundation of the bull market remains unchanged.
50 Week SMA: $102,934
200 Week SMA: $54,756
Current price $110,439 is far above the two major long-term moving averages, the long-term bull market structure is intact.
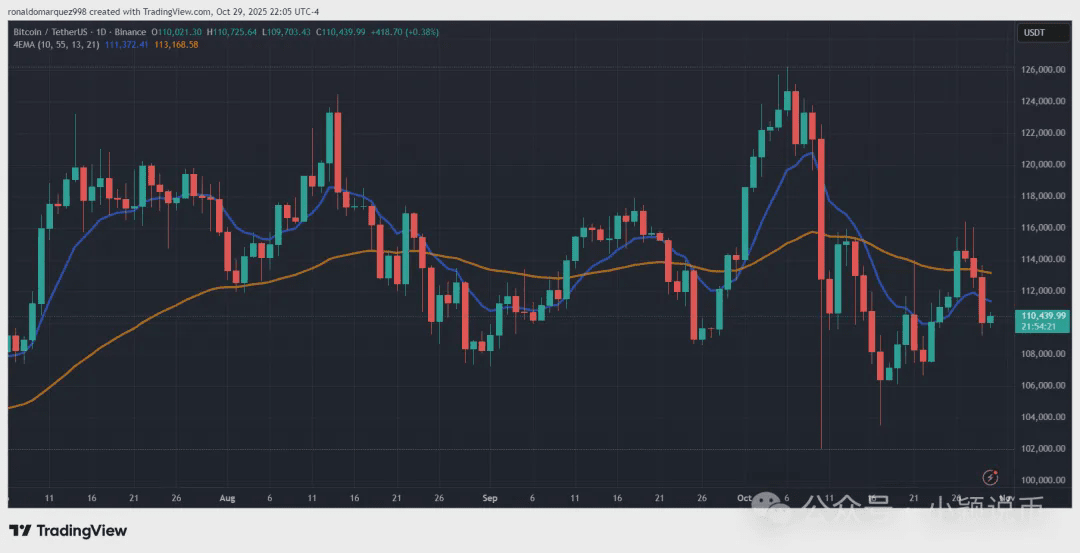
On the daily chart:
200-day moving average (109,267 USD)
Trendline support (113,100 USD)
With a double moat in hand, the room for correction is extremely limited.
2. Completely decoupled from the S&P 500
Bitcoin vs S&P 500 correlation is only -0.02, almost zero.
This means: Stock market fluctuations can no longer dominate Bitcoin's trend, an independent bull market logic is taking shape.
3. RSI Neutral + ATR sharp drop = Ready to take off
RSI = 50: neither hot nor cold, typical mid-consolidation
Average True Range (ATR) = 3,495: Volatility hits a recent low
Historical pattern: low volatility = precursor to high elasticity explosion
4. Trading range is extremely narrow, a breakout is imminent
Current oscillation range: 110,000 – 117,800 USD
The range continues to shrink, buying and selling forces tend to balance
Once broken, a one-sided market will quickly unfold
Short-term CTF tail end looks bearish (stop loss 115,623 USD), but high time frame tail end looks bullish (stop loss 114,601 USD) — the greater the divergence between bulls and bears, the more violent the breakout.
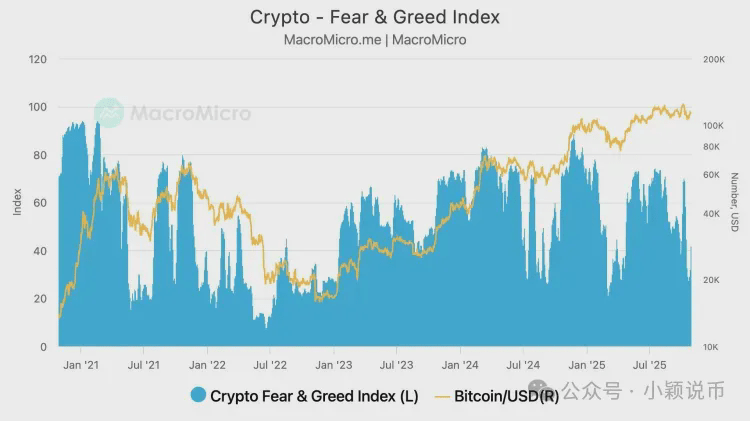
5. Market sentiment returns to rationality, panic has been exhausted
Fear and Greed Index = 51 (Neutral)
After a rapid rise in fear sentiment last week, the market has completed the "washing out fear" phase, paving the way for sustainable growth.
6. Volatility cools down, traders are not exiting, but reallocating
50-day volatility: 3,080
Narrowing trading range ≠ capital flight, but smart money is rebuilding positions at low levels
Consolidation = Energy accumulation, historically verified countless times
7. Miner costs are stable, no forced selling pressure
Mining cost: 106,400 USD
Cost ratio: 0.94
Miners are still in a slight profit state, with no liquidation pressure, the network fundamentals are as solid as a rock
8. A slight pullback of 0.53% in October is a healthy adjustment
October's historical average increase is 19.78%, currently only -0.53% this month, far from overextending seasonal dividends
The shallower the pullback, the stronger the subsequent explosion
9. Will the fourth quarter rise by 51%? Historical probabilities speak
In the past 15 years, Q4 average increase is 51.04%, 9 years have positive returns
Currently in a high probability accumulation window, seasonal tailwinds are in place.
10. Ethereum ETF expansion, the rotation engine has started
Spot ETF daily trading volume: 147 million USD
Net inflow: 133.9 million USD
Total AUM: 248.8 billion USD
Funds are flowing from Bitcoin to altcoins, the rotation cycle has begun
Conclusion: A pullback is not an end, but a glide before takeoff
Crypto Birb emphasizes:
"Currently it is not the start of a bear market, but a break in the middle of a bull market. All indicators are screaming: a breakout is imminent."
Current price 110,439 USD, still oscillating within the consolidation range.
Next stop: 117,800 USD? Or straight to 120,000?
The answer will be revealed soon.
Trading note:
Short seller stop loss 115,623 USD (short-term)
Bulls maintain 110,000 USD, breaking 117,800 USD allows for aggressive accumulation
This analysis does not constitute investment advice
