Bitcoin closed last week above $73,835 for the first time since October 2025. That number matters because it was a major resistance level the March 2024 high that Bitcoin lost earlier this year and had been struggling to reclaim ever since. Getting back above it was significant. But the price is now falling back and testing that same level from above. This week is the test that decides whether the comeback is real or whether it was just a short squeeze that fooled everyone. The honest answer right now is that nobody knows yet. The chart is giving mixed signals, the macro environment is genuinely difficult, and three separate technical warning signs are flashing caution at the same time. For traders watching closely, this is one of the most important weeks Bitcoin has had in months. For long-term holders, it is probably just another chapter in a story that has many more pages left to run.
The first warning sign is volume. The green weekly candles that pushed Bitcoin back above $73,835 came with strikingly low trading volume. In any market, price moves that happen on thin volume are suspect. Real trend changes the kind that hold and continue are normally driven by strong participation from buyers who are genuinely committed to the move. Low volume means fewer people were actually buying. It means the price went up without the kind of conviction behind it that makes a move sustainable. This does not mean the move was fake or that prices will definitely fall. It means the move has not yet proven itself. Volume needs to come in on the upside to confirm that buyers are serious. Until that happens, the current level is fragile.

The second warning sign is what has been happening in the futures market. For approximately 47 days, sellers in the futures market have been continuously paying buyers one of the longest such phases ever recorded. This is called negative funding, and it happens when so many traders are betting on the price going down that the market has to compensate the people on the other side. When the price then rises in this environment, one possible explanation is not that new buyers came in with fresh conviction. It is that the sellers who bet against Bitcoin were forced to close their losing positions, which mechanically pushes the price up without representing genuine new demand. A price rise driven by forced short covering is very different from a price rise driven by real buying. The first one tends to reverse. The second one tends to continue.
The third warning sign is the EMA150 a medium-term weekly moving average that smooths out price action over time and is watched closely by technical traders. This average runs exactly through the zone that Bitcoin is currently testing. Moving averages at key levels act as invisible battlegrounds. If buyers can defend the price above the EMA150 with conviction, it becomes a floor that supports further upside. If sellers push the price back below it, the support structure weakens and the path of least resistance shifts downward. The EMA150 sitting right at this level means the current zone is genuinely contested neither side has won yet, and the resolution in the coming days will tell a clear story about which direction has more force behind it.

On the other side of the ledger, there are real reasons to take the upside case seriously. Over the past four weeks, US Bitcoin funds saw inflows of around $2.4 billion significantly more than miners could produce in the same period. BlackRock's Bitcoin fund now holds over 800,000 Bitcoin, close to 4 percent of all coins that will ever exist. Long-term holders, who had been selling through much of the earlier part of this cycle, have started buying again according to VanEck research. Strategy purchased another 34,000 Bitcoin on April 20. These are not small or symbolic numbers. Large institutional buyers moving this much capital into Bitcoin in a short period is exactly the kind of structural demand that can sustain a price level even when the technical picture is uncertain. The question is whether this demand is enough to absorb whatever selling pressure the macro environment generates.
The macro environment is the part of this picture that makes everything harder to call. The Iran conflict continues, the Strait of Hormuz remains largely blocked, and Brent crude is running 44 percent above pre-war levels. US inflation is at 3.3 percent the highest reading since May 2024. The IMF and the ECB are openly warning about stagflation: the dangerous combination of high inflation and weak economic growth happening at the same time. The US Federal Reserve meeting that began today adds another layer of uncertainty. In this environment, Bitcoin remains primarily a risk asset. The narrative that Bitcoin protects against inflation has not consistently proven true in real crises during past stress events Bitcoin fell alongside stocks rather than rising alongside gold. This cycle has been somewhat different, possibly because of ETF structures and institutional buyers who behaved differently than retail. But the environment right now has enough moving parts that confidence in any single scenario is probably misplaced.

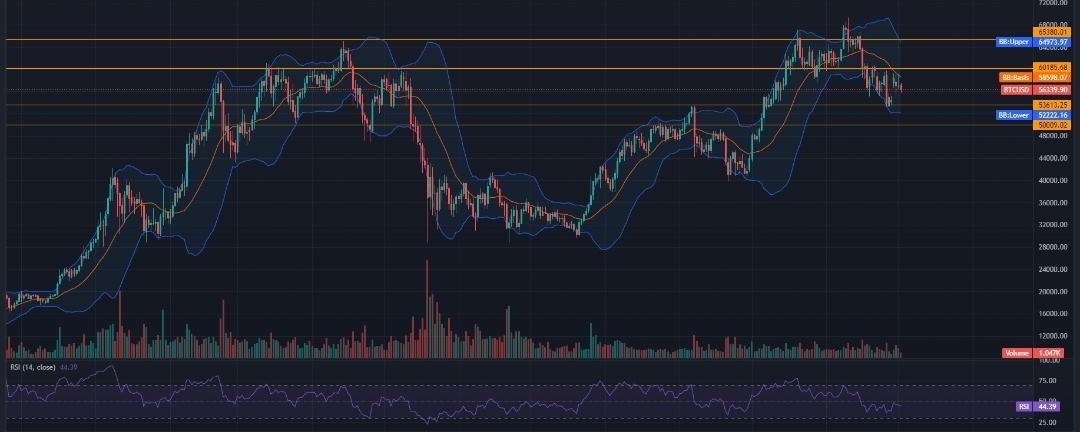
Three paths sit in front of Bitcoin from here. The most likely in the near term is a sideways phase Bitcoin oscillating between roughly $67,000 and $80,000 until a clear trigger forces direction. A variation of this sees Bitcoin slowly climbing into the $94,000 to $100,000 resistance zone before a sharp correction. The second path is a genuine move to the upside, requiring the current support to hold and fund inflows to continue but a real trend change only begins much higher, at $90,000 to $100,000 where the major downtrend line runs. The third path goes lower in stages: a first catch zone around $67,000 to $68,000 where the long-term EMA200 and the lower range edge sit, then $53,000 to $57,000 if that breaks, and a real bear market scenario that eventually tests $40,000. That round number tends to act as a magnet many buyers wait there, which is exactly why the market may eventually test it and briefly undershoot before recovering.
Which path plays out probably has less to do with charts and traders than with the macro picture the Fed decision, the Iran situation, and whether inflation continues rising or starts to cool. Institutional players now move Bitcoin's price more than retail ever did, which means the analysis that worked in earlier cycles needs adjusting. Long-term holdings and regular savings purchases make sense to hold unchanged through all of this noise. Short-term trading in this environment requires significantly reduced position sizes and patience for a clean signal that has not yet arrived. Sideways phases with unclear macro backdrops are exactly when the cost of haste is highest and the value of waiting is most underappreciated. The market will show its hand. The discipline is in waiting for it rather than guessing.
