
Ethereum is signaling strong demand and attracting buying pressure from traders and investors.
The MACD line crossed above the signal line, with histogram approaching zero, confirming bullish potential.
Large whale orders increased accumulation ahead of potential upward price movement in Ethereum markets.
Ethereum’s price tested the $3,200 support and is signaling potential upward momentum in the market. Technical indicators are reinforcing a cautious bullish outlook price action and order patterns.
Support Zone and Daily Price Action
Ethereum has repeatedly bounced from the $3,200–$3,300 support area,which has confirmed it as a strong demand zone which has attracted buyers, helping stabilize price during recent declines. The consistency of rebounds indicates market participants are defending this level.
Recent daily charts show Ethereum rebounding from the $3,200 zone, targeting higher levels near $4,500–$4,800. The green arrow on technical charts suggests potential upward movement from this foundation.
 Source Kamran Asghar Via X
Traders may interpret this as renewed buying confidence in the market.The MACD indicator supports the potential recovery.
The MACD line has crossed above the signal line, moving from deeply negative levels. Histogram bars are turning lighter red, approaching zero, showing reduced selling momentum.
Short-Term Resistance and 4-Hour Chart Trends
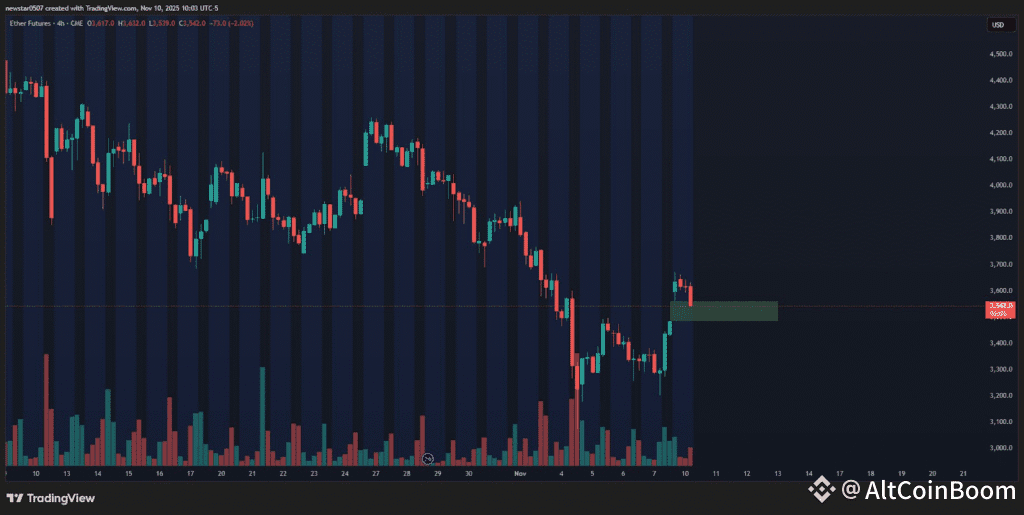
On a 4-hour Ether Futures chart, Ethereum has bounced from lows near $3,200 toward $3,600. A resistance zone is visible around $3,600, showing sellers entering the market. Price action around this area is critical for short-term momentum.
Volume analysis indicates buyers attempted to regain control, supporting the recent upward move. However, sharp red candles suggest hesitation, with selling pressure emerging near $3,540.
Source CW Via X
If the price stays above $3,520, it could start climbing toward $3,700–$3,800. On the other hand,a drop below that support level, might see it slide toward $3,300–$3,100.
Whale Activity and Market Behavior
Ethereum’s spot order chart from 2022 to 2025 shows large whales accumulating at key levels. Normal, small whale, and big whale orders provide insight into market trends and price support. Retail activity often aligns with corrections.
Whales buying $ETH now! pic.twitter.com/TH22zk7dpk
— Crypto Rover (@cryptorover) November 10, 2025
High retail selling in early 2022 coincided with price declines and whale accumulation increased near market lows, supporting subsequent recoveries. Data suggest smart money accumulation often precedes upward price movement.
As of late 2025, large whale orders near $3,500–$4,000 indicate strategic positioning. This behavior suggests readiness for potential bullish continuation. Tweets from analysts note strong support at $3,200 and the MACD crossover confirming momentum shifts.