
$XLM’s current market structure replicates its 2017 Wyckoff cycle, showing deep accumulation, re-accumulation, and potential preparation for a major breakout.
Technical indicators, including TD Sequential, align with historical patterns, suggesting XLM may have formed a local bottom before the next upward phase.
Analysts project breakout targets at $0.681 and $1.29, with potential price expansion following the structural pattern observed in previous accumulation cycles.
XLM is exhibiting market behavior similar to its Wyckoff accumulation cycle from 2017, indicating that a structure breakout could be setting up. Analysts are witnessing similar price structures develop, indicating that the market may be shifting into a new phase of expansion.
XLM’s Market Structure Mirrors 2017 Accumulation Cycle
Crypto analyst EtherNasyonaL highlighted that $XLM is repeating the Wyckoff pattern that preceded its 2017 surge. Historical graphs indicate significant accumulation followed by re-accumulation, and we believe that this could lead to a very strong movement in price.
$XLM is repeating its historic Wyckoff cycle again.
Just like in 2017.
Deep accumulation, quiet reaccumulation, and then the final phase before the explosion.
The chart before the parabolic expansion. pic.twitter.com/9cAej23Of8
— EᴛʜᴇʀNᴀꜱʏᴏɴᴀL (@EtherNasyonaL) November 9, 2025
From 2015 to 2017, XLM trended sideways with low volatility, slowly building a solid base. This slowly transitioned to re-accumulation, where smart money entered before the parabolic expansion that took XLM to its 2018 all-time highs near $0.90.
Today, the pattern appears almost identical. XLM’s price has compressed below $0.30, reflecting a similar consolidation stage. Analysts suggest that if the fractal continues, a final markup phase may be approaching, with potential distribution zones between $2 and $4.
Technical Indicators Support Potential Bottom Formation
Supporting this structural outlook, trader Ali reported that the TD Sequential indicator flashed a buy signal for XLM. Historically, these signals have aligned with local market bottoms, potentially marking the beginning of the next upward move.
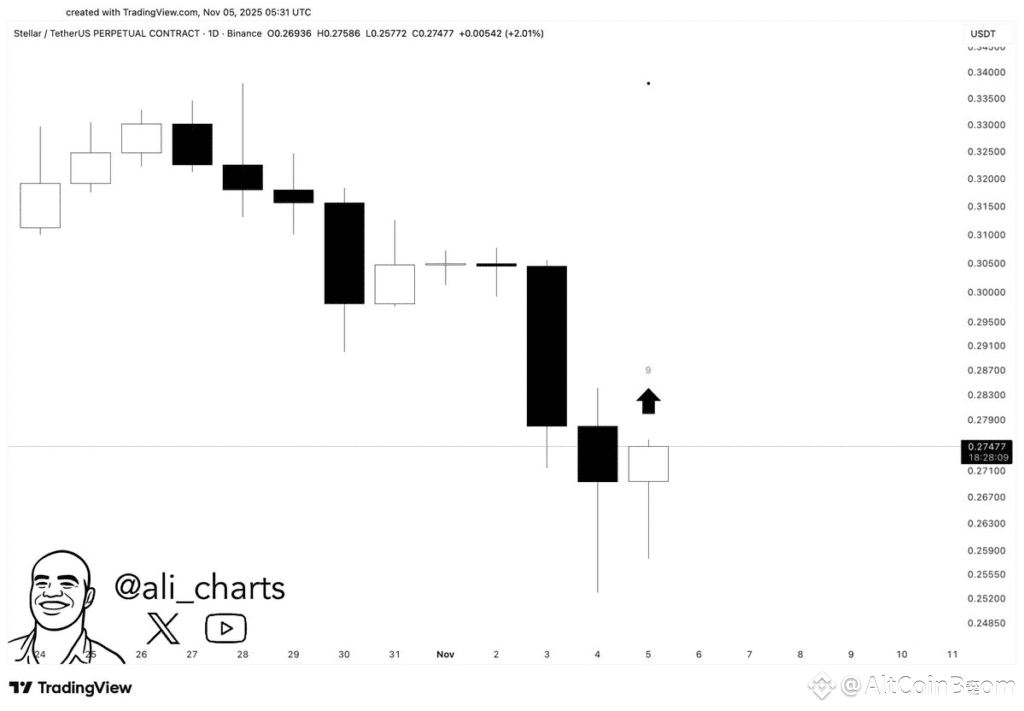 Source: Ali Charts
Volume patterns are also showing stability, similar to the 2017 setup. The quiet accumulation and subsequent re-accumulation suggest a controlled buildup rather than market distribution, reinforcing the potential for a structural breakout.
Analysts are monitoring price behavior above critical resistance levels. A confirmed breakout would validate the Wyckoff pattern, signaling the next phase of XLM’s growth and possibly attracting renewed market interest.
Analysts Project Substantial Upside for XLM
Market commentator Javon Marks maintained that $XLM’s breakout target at $0.681 remains intact. He suggested that momentum could propel gains above 120%, possibly forcing prices toward $1.29, should key levels be overcome.
$XLM's breakout target at $0.681 has not changed and seeing the huge response since breakout towards it, prices may only be setting up here for an over 120% climb to reach and break above it!
A break above brings $1.291819 into play…
(Stellar) https://t.co/aqiDM8Dq4V pic.twitter.com/ufsDQASm3k
— JAVONMARKS (@JavonTM1) November 10, 2025
The upcoming move is in good support with Wyckoff theory re-accumulation phase has always preceded large upward trends. Traders expect increased participation once pthe rice confirms a structural breakout above resistance.
As analysts track this recurring Wyckoff pattern, the convergence of historical price structure and technical indicators positions XLM for a critical phase. The market appears poised for a potential structural breakout if current patterns continue unfolding.