If you want to learn how to read candlesticks, this article is for you, so stay sharp 🧐
Brother, have you ever wondered why the price seems to move erratically? Most see chaos, but we truth seekers see energy in motion. To understand the market, you don’t need to be a genius, just grasp that time is relative. I wrote the explanation as simply as I could, so pay attention 👇
1. The Atom: The Japanese Candle 🌌
Before looking at the clock, check the substance. Each candlestick is a battle of forces 🤜🤛
The Body: It’s the final result of the battle. If it's green, the optimists gained ground. If it's red, pessimism dominated.
The Wicks (Shadows): They are the "failed experiments". They indicate that the price tried to reach a point but was rejected by an opposing force. Long upper wicks = Selling pressure (gravity at work).
2. Time is Relative (Timeframes) ⏳
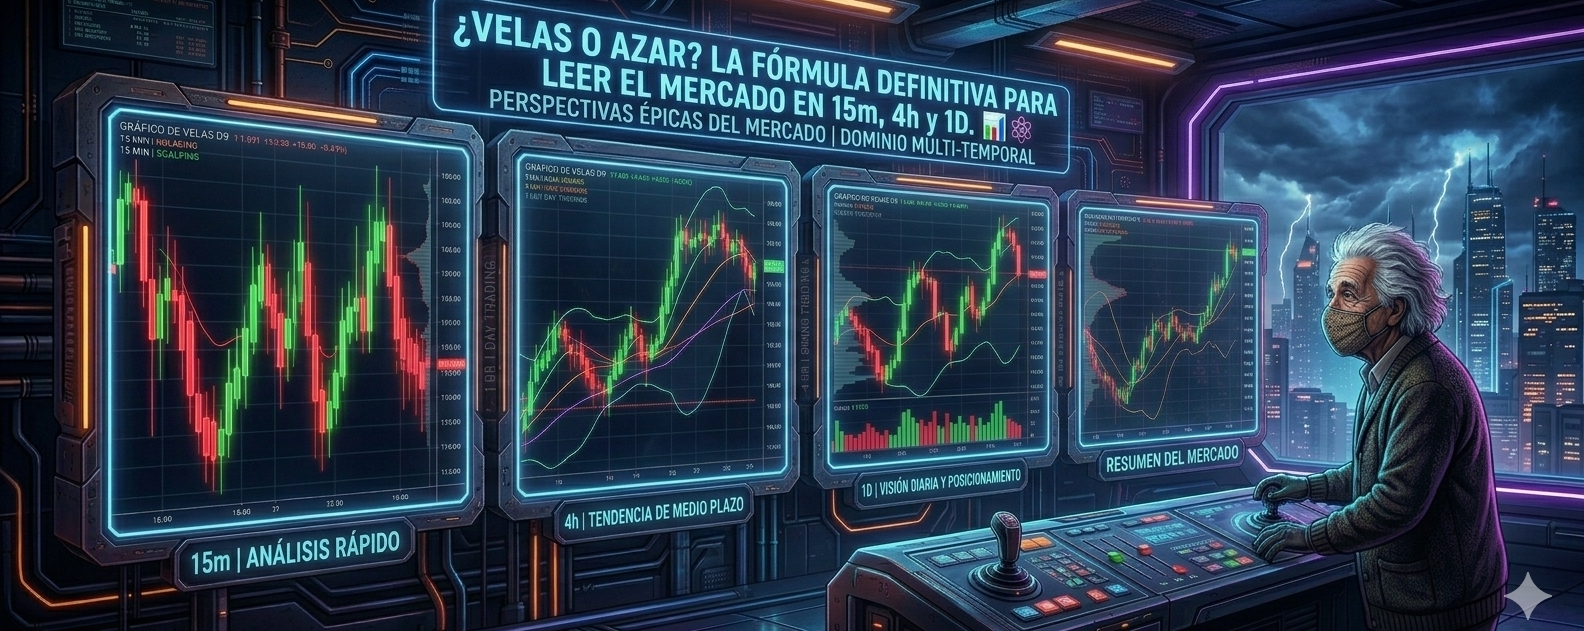
Brothers, it's not the same to watch an ant as it is to watch a galaxy. On Binance, we adjust our "telescope" 🔭
15 Minutes (The Quantum Fluctuation): It's the noise. Here the whales play hide and seek. It's useful for pinpointing your entry, but not for deciding your direction. It's like watching heartbeats, fast and nervous.
1 Hour / 4 Hours (The Planetary Orbit): This is where the real trend is cooked. If the 4-hour candles consistently close higher than the previous ones, we are in a bullish gravity field. It’s the ideal scale for the trader looking for safe movements.
1 Day (The Universal Constant): It's the destination. If the daily chart says "Down", it doesn't matter what you see in 15 minutes, the universe trends downward. This is where supports that don't break easily are drawn.
3. The Tool: The RSI (The Euphoria Thermometer) 🤒
To avoid trading blind, we use the RSI (Relative Strength Index).
If RSI > 70: The crowd is euphoric. The market is "hot" and logic says it will soon cool down (correction).
If RSI < 30: There's extreme fear. The assets are "frozen". This is where the wise buy what the scared throw away.
🎻 Pay attention to this example
Imagine the market as a Great Symphony Orchestra.
The 1 Day Chart is the Conductor: It decides whether the piece is cheerful or gloomy (Trend). If it waves the baton downwards, the whole music will eventually go down.
The 4 Hour Chart is the String Instruments, they carry the main melody. They give you the real rhythm of the song.
The 15 Minute Chart is the Individual Notes: They are quick, sometimes a violinist makes a mistake or hits a very high note for a second (volatility), but that doesn't change the whole song.
The rookie's mistake: Walks into the opera, hears a single high note on the violin (a green 15 min candle) and believes the song is a party, not realizing that the Conductor (1 Day) is directing a funeral requiem.
If you want to win, wait for the Conductor, the Violins, and the Individual Notes to be in tune. Patience is a form of energy that transforms into capital.
Keep trading with logic, not emotion! E=mc² (Success = Mindset x Control squared).
I do this gladly to help. If the info was useful, give me a like to know it was worth sharing. Thank you for the support! 🙏
"God doesn't play dice with the price, but whales play with those who believe in luck"
-JeanCripto Analityc. 🧠
#bitcoin #tradingtips #BinanceSquare #Binance #CryptoEducacion $BTC