
Ethereum’s declining exchange balance and strong holder activity indicate rising accumulation in anticipation of a potential supply squeeze.
Tom Lee projects Ethereum between $9K and $12K, linking tokenization growth and institutional adoption as drivers for the next cycle.
Despite whale purchases worth over $1.3 billion Ethereum is struggling near its 200-day moving average.
After slipping 2.42% over the past day,Ethereum (ETH) is changing hands at $3,400.48.Traders are closely tracking liquidity shifts and whale moves which are signaling growing optimism in the crypto market.
Top-Down Liquidity Flow Shapes Crypto Markets
Bitcoin remains the primary driver of market liquidity, with Ethereum following as the second key asset. Tom Lee’s recent statements from Fundstrat note that Bitcoin is still underrepresented in traditional portfolios.
He expects potential growth toward $150K-$200K if institutions rotate in.Lee also projects stronger gains for Ethereum, forecasting prices between $9K and $12K in the coming months.
NO ALTCOIN RUN WITHOUT ETH MOVING FIRST
Tom Lee says Bitcoin is still underowned, even with some OGs selling above $100K. If institutions rotate in, he believes #Bitcoin can still push toward $150K to $200K, and the asset class just isn’t represented in traditional portfolios… pic.twitter.com/FiowEUTHqt
— CryptosRus (@CryptosR_Us) November 12, 2025
According to his team, growth in stablecoins, tokenized gold, and Wall Street asset tokenization depends on Ethereum’s smart contract infrastructure. These fundamentals suggest Ethereum’s price movements could signal broader altcoin cycles.
Historical data supports this top-down rotation model. Research in the Journal of Risk and Financial Management shows that Ethereum dominance preceded 80% of major altcoin surges since 2017.
Observing Ethereum’s performance provides traders an early indication of potential market trends.
Exchange Balances Indicate Accumulation Trends
Glassnode data shows a steady drop in exchange balances for both Bitcoin and Ethereum. Bitcoin’s share slipped from about 16% in mid-2023 to 12%, while Ethereum’s fell from roughly 19% to under 13% by late 2025.
This persistent downtrend implies reduced selling pressure and potential liquidity constraints on exchanges. The recent multi-year lows of 10–11% for both assets suggest that fewer coins are available for immediate sale.
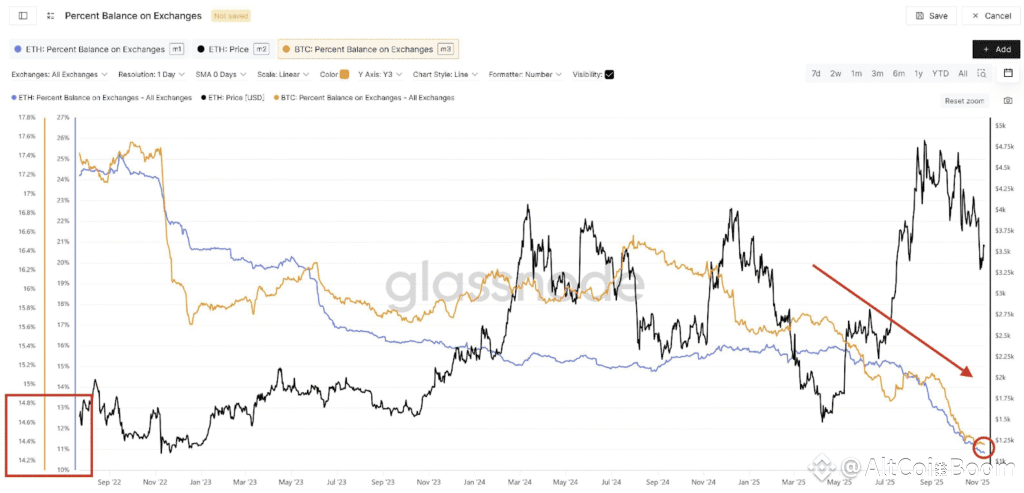
Source Tweet on X
Long-term holders appear to be consolidating positions in self-custody wallets.The structural withdrawal trend may precede supply shocks if demand rises.
Investors observing these metrics may anticipate market movements based on the available liquidity of major cryptocurrencies.This behavior aligns with a typical accumulation seen during bullish cycles.
Technical Resistance at the 200-Day Moving Average
Recent attempts around $3,440–$3,566 faced resistance, mirroring previous bearish patterns and repeated rejections at the 200-day moving average, a critical long-term trend indicator.
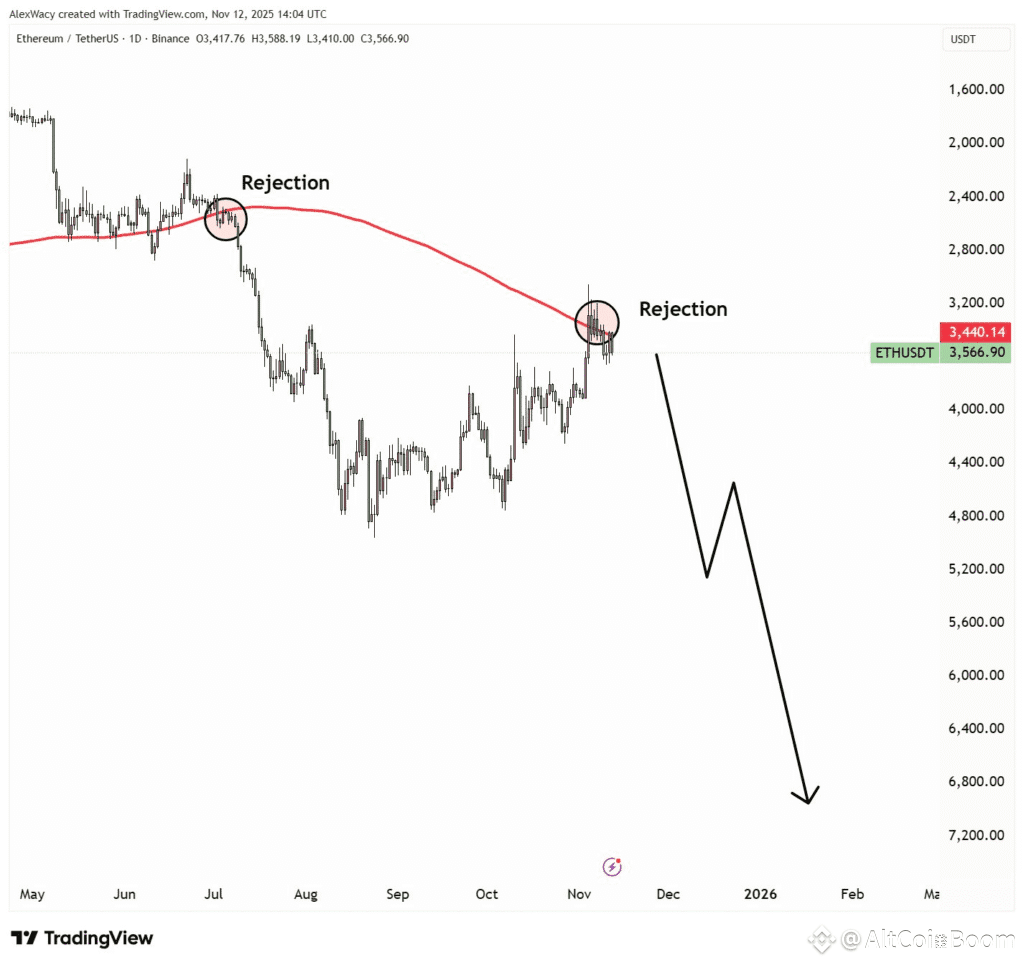
Source Tweet on X
Analysts indicate that failure to break above this moving average can trigger renewed downtrends. The black arrow on daily charts suggests potential declines toward support zones below $3,000 if selling pressure intensifies.
Market activity is further influenced by high-profile purchases and sales.0xNobler noted a whale buying 385,000 ETH worth $1.3 billion. Institutions such as BlackRock and Binance reportedly sold significant Bitcoin positions which illustrate short-term volatility amid ongoing market consolidation.