

Bitcoin revisits a golden Fibonacci area where earlier cycle support formed before a breakout to new highs.
Market data shows active trading and steady liquidity as price moves within a broad 24-hour range.
Trader sentiment remains focused on structural patterns that resemble the Q1 2025 setup.
Bitcoin’s recent price pattern shows a controlled retracement toward a major Fibonacci level, forming a structure that resembles earlier market behavior. Traders are assessing whether the current range will confirm a new macro higher low.
Market Structure Shows Repetition Across Cycles
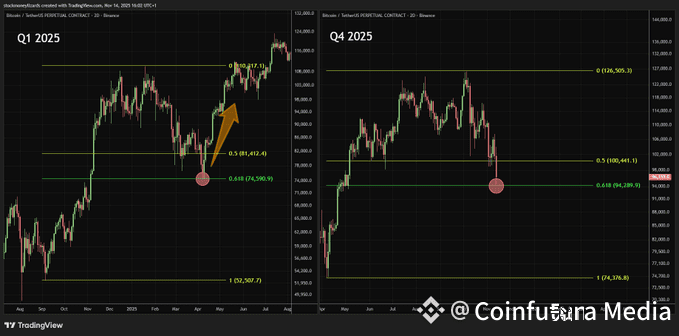
Bitcoin continues to form higher macro lows near the golden Fibonacci retracement, a pattern emphasized in a recent post from CryptosRus. The comparison points to a recurring setup where a sharp rally peaks, followed by a return to a key support level. This pattern is present in the Q1 2025 period and the current structure of Q4 2025, forming close visual symmetry.
 Source: CryptosRus/X
Bitcoin in the previous cycle hit its highest point around $110,000 and dropped into the 0.618 region around the $74,599 mark. That level stood strong and created a macro higher low resulting in a strong recovery. Price has since broken through the 0.5 retracement at $81,472 and recorded another peak at $126,707. The backside was more of a reset than a breakdown.
The current pattern shows a similar descent from $116,506 toward the golden zone around $92,499. The controlled nature of the pullback mirrors the earlier structure, suggesting another potential higher low if the level continues to hold. The setup noted by CryptosRus places attention on whether the market is entering another shakeout phase before a broader move.
Price Action Holds Steady Within a Broad Intraday Range
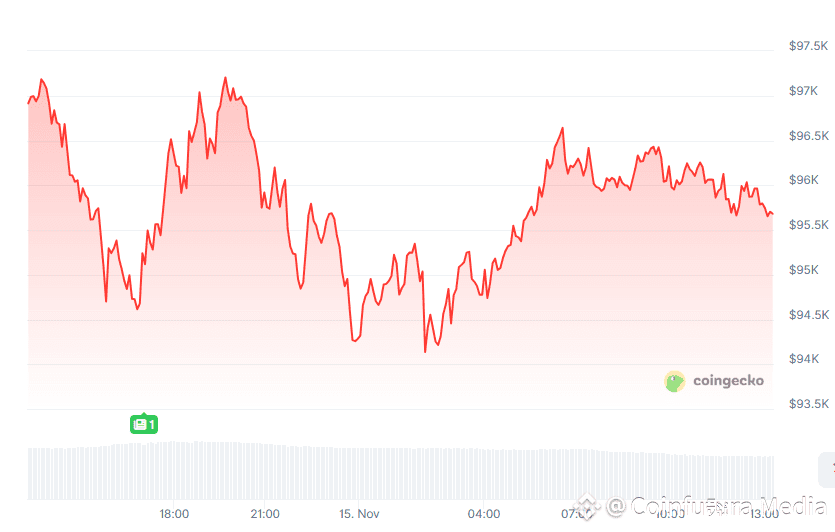
Bitcoin as of writing is trading at $95,703.32, having decreased by a small of 1.3% in the last 24 hours. The asset fluctuated between $94,137-$97,203 in the course, which is actively volatile but structurally correct. Volume spikes appeared during downward moves, including a moment where price touched $95,382 as trading volume exceeded $123 billion.
 Source: coingecko
The intraday chart shows several recovery attempts after the initial decline. Buyers stepped in near the lower end of the range, creating short bursts of upward movement, though resistance near $96,500 limited continuation. The price dynamics indicates reluctance yet a steady swing in the set range.
The depth of the market is also quite high, reaching a total valuation of approximately $1.9 trillion and a supply of 19.95 million BTC in circulation. The liquidity also facilitates the continued consolidation, which enables the market to absorb the volatility without structural distortion.
Traders Monitor Broader Conditions as Support Zone Holds
External conditions mentioned by CryptosRus—such as liquidity shifts and the start of quantitative tightening—shape the backdrop around the current setup. These factors have influenced volatility throughout the year, contributing to repositioning during each major retracement.
The market also reflects stable participation across major exchanges. Data shows steady long interest on platforms like Binance and OKX, aligning with the view that traders are watching for confirmation rather than preparing for deeper declines. Liquidations remain contained, suggesting controlled market activity rather than capitulation.
As Bitcoin moves within the golden Fibonacci level again, traders assess whether the controlled retracement will lead to another structural pivot similar to the earlier cycle. The repeated pattern keeps attention on the support zone as the market approaches the next directional stage.
The post Bitcoin Structure Mirrors Earlier Cycle as Price Holds Near Key Fibonacci Level appears on Coin Futura. Visit our website to read more interesting articles about cryptocurrency, blockchain technology, and digital assets.
