$ZEC Good question. By “shot analysis Zec,” I assume you mean technical analysis (TA) for Zcash (ZEC). Here’s a guide on how to do a good TA on ZEC + some key things to watch, plus current-ZEC specific analysis. (If by “shot” you meant something else, tell me — I’ll adjust.
---
Part 1: How to Do Technical Analysis (TA) for ZEC
1. Get a Charting Platform
Use platforms like TradingView, CoinGecko, Binance, or Investing.com to view ZEC price charts.
Choose different timeframes: daily, weekly, 4-hour, etc.
2. Draw Key Levels: Support & Resistance
Identify support (where price tends to bounce up) and resistance (where price tends to be rejected) levels on the chart.
Use pivot points — many TA tools provide classic, Fibonacci, Camarilla pivot levels. For ZEC, pivot point data is available.
Use trend lines — connect highs and lows.
3. Use Moving Averages (MAs)
Commonly used: SMA (Simple Moving Average) and EMA (Exponential MA).
Look at different periods: MA20, MA50, MA100, MA200.
When price is above a MA, that MA can act as support; if below, it can act as resistance.
Check MA crossovers (e.g., MA50 crossing MA200 — golden or death cross).
4. Use Oscillators / Momentum Indicators
These help to understand if ZEC is overbought or oversold, or what the trend strength is:
RSI (Relative Strength Index): measures speed and change in price movements.
Stochastic Oscillator and StochRSI: more sensitive to price changes.
MACD (Moving Average Convergence Divergence): shows momentum and trend direction.
AX (Average Directional Index): indicates strength of a trend.
CCI (Commodity Channel Index), Williams %R, ROC (Rate of Change), Ultimate Oscillator — other useful oscillators.
5. Volume Analysis
Always check volume along with price moves.
A breakout (above resistance or below support) is much stronger if volume is high.
Divergences between volume and price can be early warnings (e.g., price goes up but volume goes down).
6. Use Chart Patterns
Look for chart patterns: triangles, head & shoulders, double top/bottom, flags, wedges.
Patterns can give clues about likely future price direction (breakout or breakdown).
7. Use Risk Management
Define your entry point, stop-loss, and take-profit before making a trade.
Decide your position size based on how much you’re willing to lose.
Use risk-reward ratios (e.g., 1:2 or 1:3).
8. Use Multiple Timeframes
Analyze ZEC in both a higher timeframe (like daily or weekly) for trend and a lower timeframe (4-hour or 1-hour) for entries.
This helps to align trades with the overall trend.
9. Keep an Eye on News
Zcash is a privacy coin, so developments around privacy regulations, adoption, or technical upgrades (like protocol improvements) can greatly affect price.
Also watch macro crypto trends — ZEC often moves in relation to the broader crypto market.
---
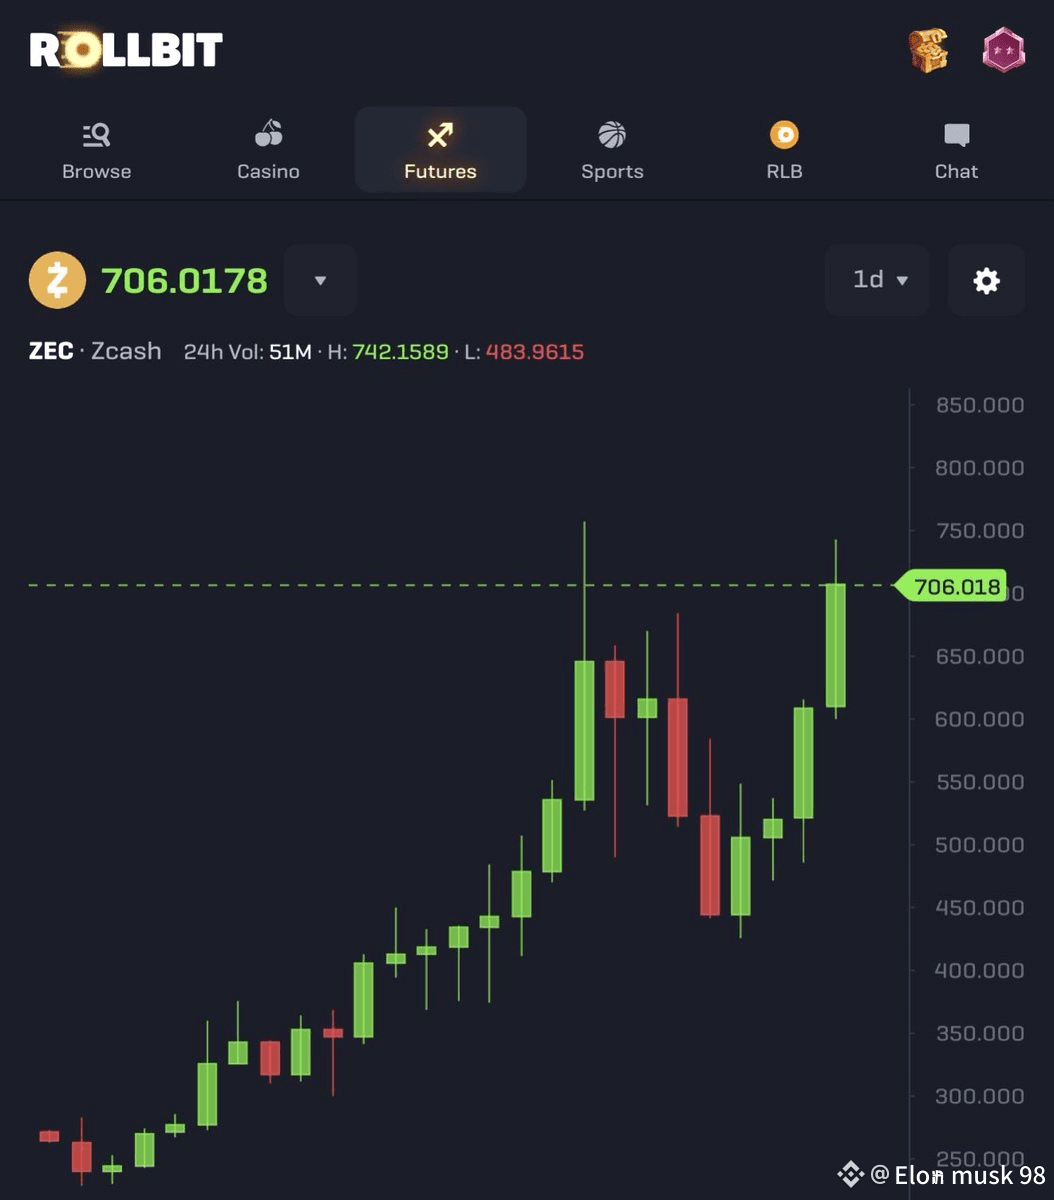
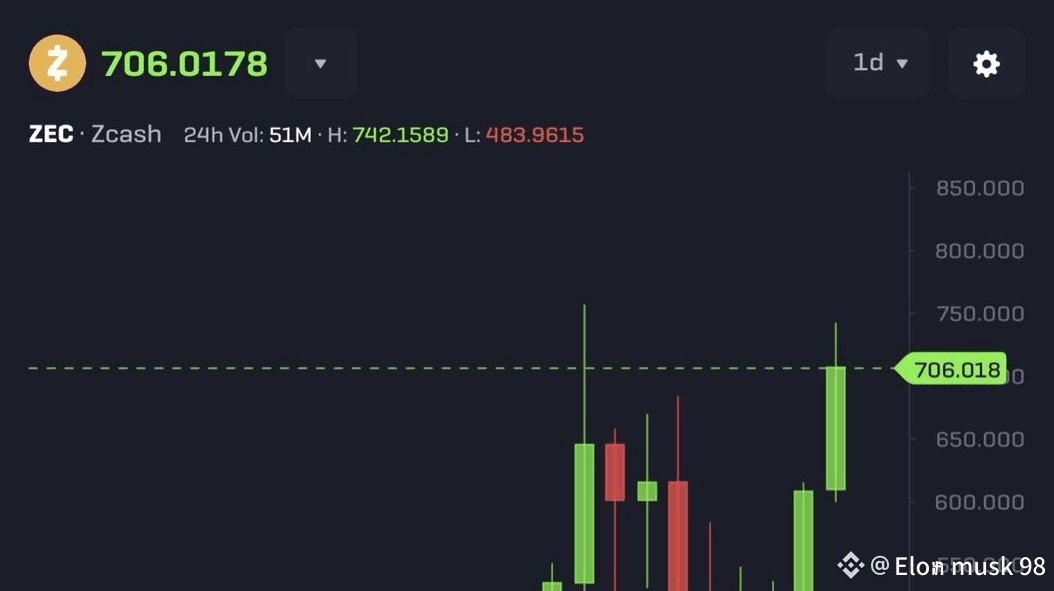
art 2: Key ZEC-specific Technical Insights (Based on Current Data)
According to Investing.com, ZEC’s current technical summary for ZEC/USD is “Strong Buy” on many timeframes.
Key indicators:
RSI (14) is ~ 64.3 (on some platforms), which is bullish but not yet extreme.
MACD is positive on Investing.com, suggesting upward momentum.
Some moving averages (e.g., MA20, MA50) are showing Buy signals.
Support & Resistance from CoinCheckup:
Support levels: around $524.24, $443.01, $401.06.
Resistance levels: $647.41, $689.35, and $770.59.
On some charts, volatility (ATR) is high, indicating possible strong swings.
According to community discussion (Reddit): some think ZEC is “overbought” and could correct; others are bullish because of potential institutional adoption or scarcity.
There’s also a halving event for ZEC that could drive future price action, according to some Redditors.
---
Part 3: How to Do a “Shot” / Quick Analysis (If You Mean a Short-Term Trade)
If by “shot” you meant a short-term trade or quick analysis (for making a trade):
1. Zoom into a lower timeframe (1-hour or 4-hour) chart.
2. Use short-period MAs (e.g., EMA 20, EMA 50).
3. Use momentum indicators like RSI or Stoch to time entry:
For a buy: wait for oversold + bullish crossover + support bounce.
For a sell: wait for overbought + bearish divergence + resistance rejection.
4. Confirm with volume: a breakout or bounce needs volume strength.
5. Set a tight stop-loss: since short-term trades are riskier.
6. Use target levels: define where you will take profit (resistance, previous high, pivot).
Part 4: Risks & Things to Be Careful About
Privacy coin regulation risk: ZEC is a privacy coin, and regulatory changes could impact its demand.
Volatility: Crypto like ZEC can swing a lot; TA signals can fail.
Liquidity: Depending on the exchange or trading pair (ZEC/USD vs ZEC/BTC), liquidity might differ.
Technical upgrades: Protocol changes or forks can drastically affect price.
Sentiment risk: Crypto prices are often sentiment driven — what TA shows may be invalidated by news.
--
If you like, I can do a current (live) technical analysis for ZEC (with chart levels, possible trade ideas, support/resistance) — do you want me to do that?#MarketPullback #PowellRemarks