$BTC is currently in a bearish phase, showing signs of a potential short-term reversal near key support zones. The chart reveals a descending pattern with repeated sell signals, while broader market sentiment remains cautious.
📊 Chart Pattern Analysis (Heikin Ashi · 1h · Binance)
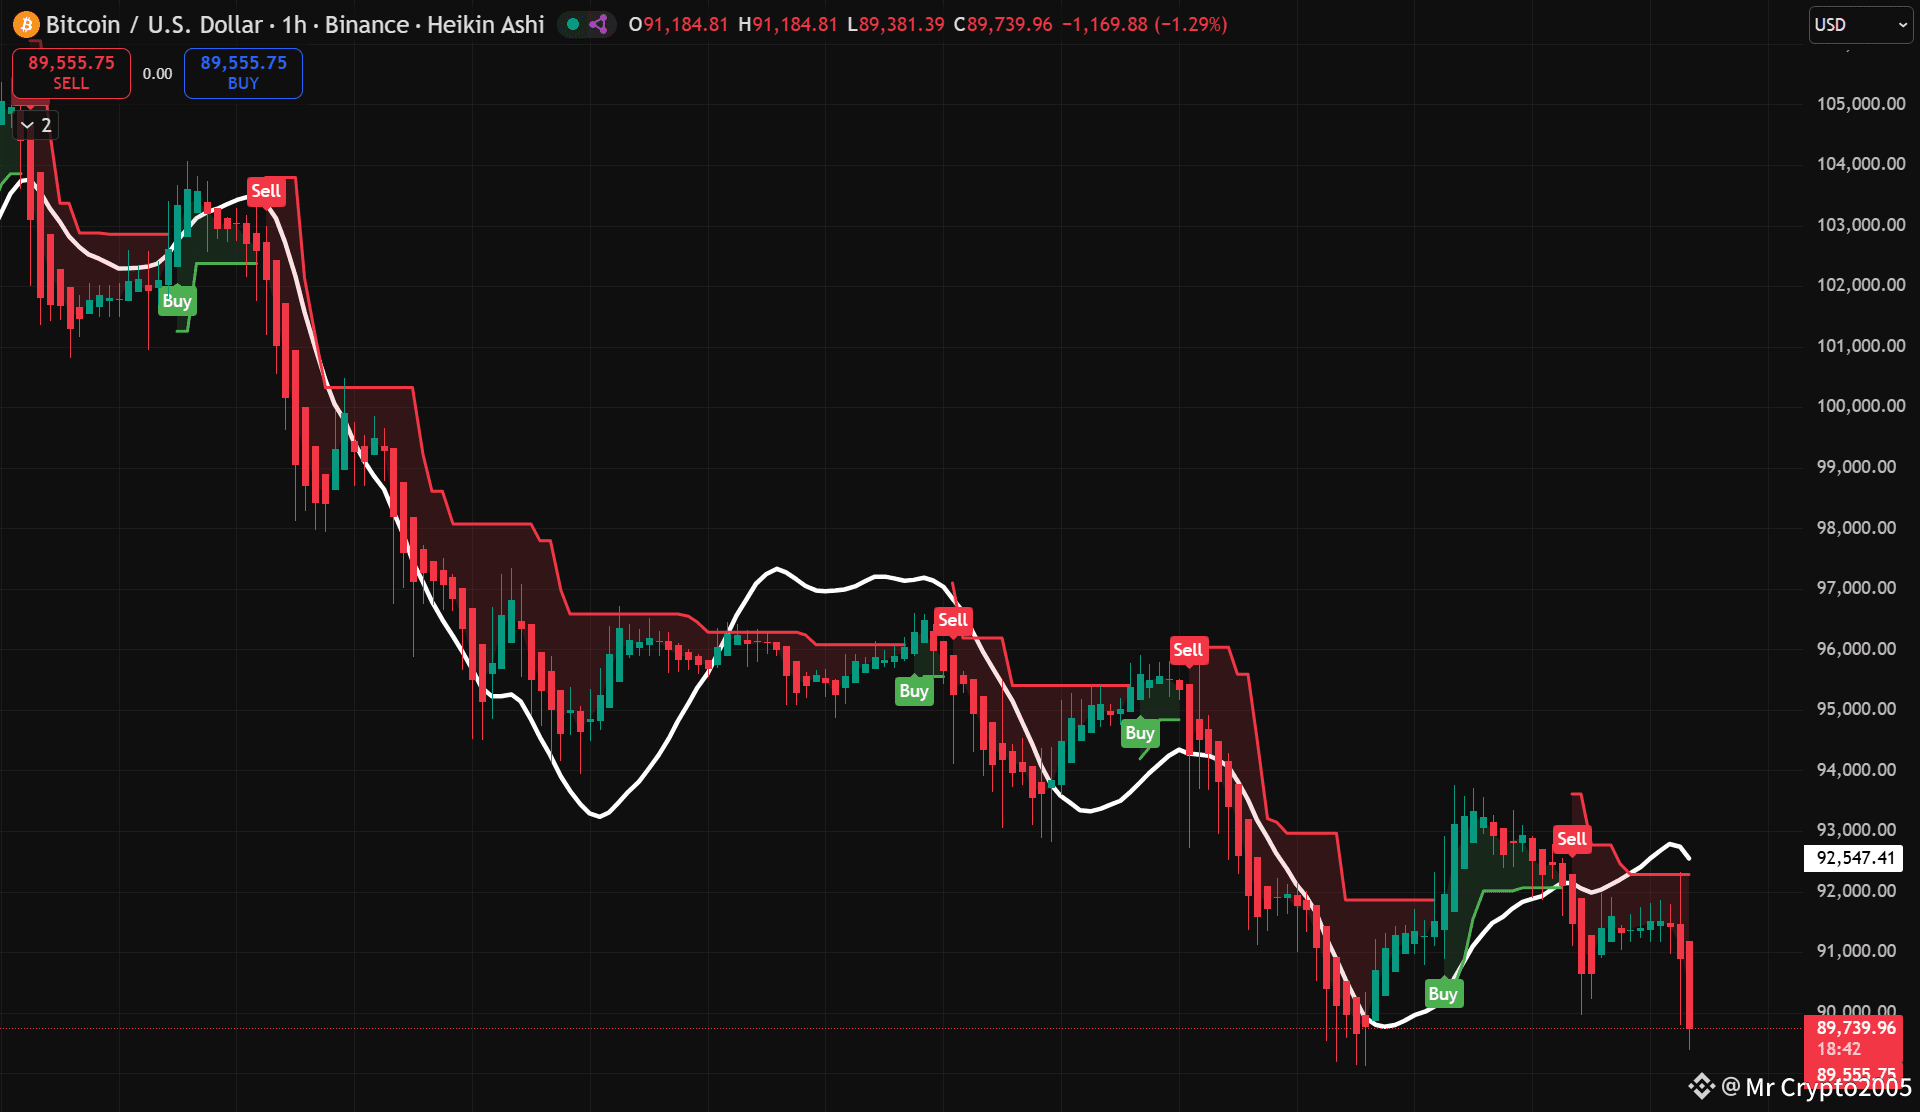
My uploaded chart shows a short-term bearish trend with the following key patterns:
Descending Channel Formation: Price action is moving within a downward-sloping channel, confirmed by lower highs and lower lows.
Repeated Sell Signals: Multiple red "Sell" labels indicate consistent bearish momentum. The most recent SELL signal is at $89,555.75, just below the current price.
Support Zone Interaction: Price touched a low of $89,381.39, which aligns with the lower boundary of the red shaded trend-following indicator — a potential support zone.
Moving Average Resistance: The white MA line is sloping downward, acting as dynamic resistance. Price has failed to close above it consistently.
Heikin Ashi Candles: Dominantly red with small bodies and long upper wicks — signaling weak bullish attempts and strong bearish control.
🌐 BTC Market Situation (as of November 19, 2025)
Current Price: ₹79,29,133.23 INR (~$90,749.85 USD)
24h Change: -3.95% in INR terms, but a slight 0.62% uptick in USD — reflecting currency volatility
Market Sentiment: Extreme Fear — Crypto Fear & Greed Index at 16/100
Technical Setup:
BTC is hovering near the 0.618–0.66 Fibonacci retracement zone, historically a strong demand area
RSI is entering oversold territory, suggesting weakening selling pressure
If BTC holds above $91,100, a bounce toward $96,900–$103,000 is possible
If selling continues, next support lies between $89,100–$83,200
Onchain Metrics:
Exchange inflows are rising — over 6,000 BTC moved to Binance in October, indicating selling intent
Whale accumulation is ongoing, but network activity and open interest are declining
🔍 Summary Outlook
Short-Term Bias: Bearish with potential for reversal if support holds
Key Levels to Watch:
Support: $89,100 – $83,200
Resistance: $91,100 (Fibonacci pivot), $96,900 – $103,000
Strategy Tip: Wait for confirmation of reversal (green Heikin Ashi candle + MA crossover) before entering long trades. Use tight stop-losses below $89,000.
