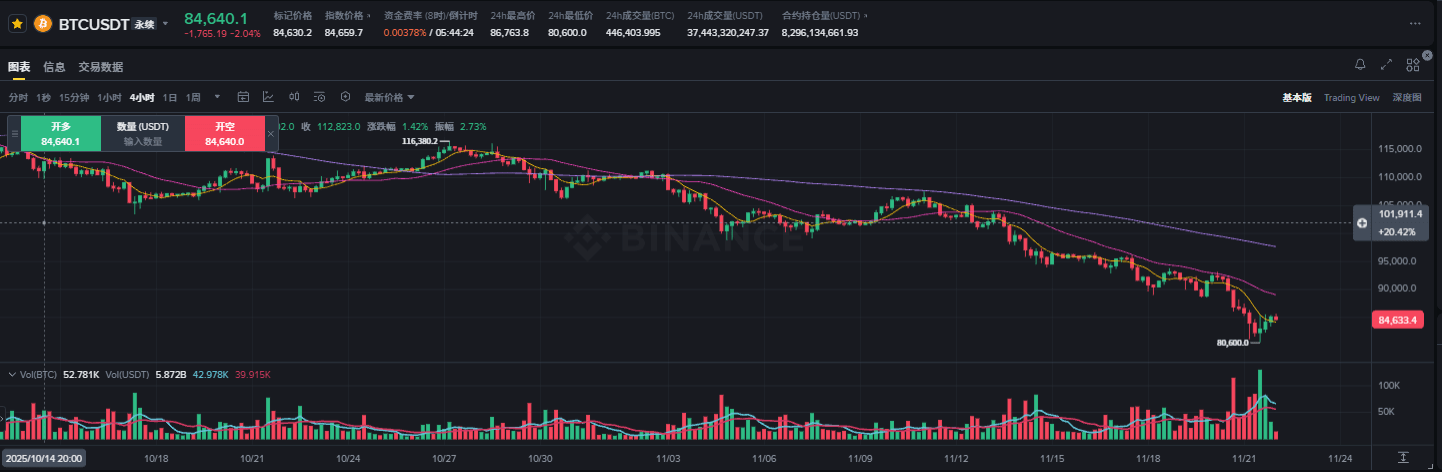
I am your market "disassembler", delivering the straight goods. The candlestick chart will guide you through the review: from October to now, Bitcoin has precisely "rolled" down from 116,000 USD to the recent 80,600. The rebound looks strong, but the bears are singing all the way.
Technical Analysis: The moving averages have fully crossed bearish, and the daily chart shows consecutive declines. The rebound is merely the old investors being trapped with no options; the main players are using news to drive prices up for profit-taking. Your focus on the "golden pit" at 84,600 may just be bait for the main players.
Liquidity Analysis: Trading volume has surged, but the hotspots are all in the loss-cutting phase; the global liquidity inflection point has arrived, with Japanese long-term bond yields skyrocketing, and the carry trade collapsing. Can the crypto market still afford to charge recklessly? May I ask the various "bottom-fishing heroes": is your capital supported by yen, or are you too frightened to move by the rising yields of US bonds?
Macroeconomic Perspective: The trend has changed! Don't just follow the crowd to buy the dip; wait until the global main force sets the tone and liquidity truly eases. With BTC dropping like this, do you still dare to go all in, or are you preparing to wait for a quick low buy?
Opinions and Interactions:
Have you bought the dip tonight? Where are you betting the next support level? Do you think BTC can quickly reverse, or will it continue to decline? See you in the comments—sharp and to the point, come and challenge if you don't agree!