Bitcoin (BTC) has managed to hold its key support levels after experiencing a prolonged decline, and it has begun to recover. Since dropping to $80,600 last Friday, the price has risen by $7,500 over the weekend, which largely indicates that the worst may be over. However, is this really the bottom?
Can BTC hold these price levels?
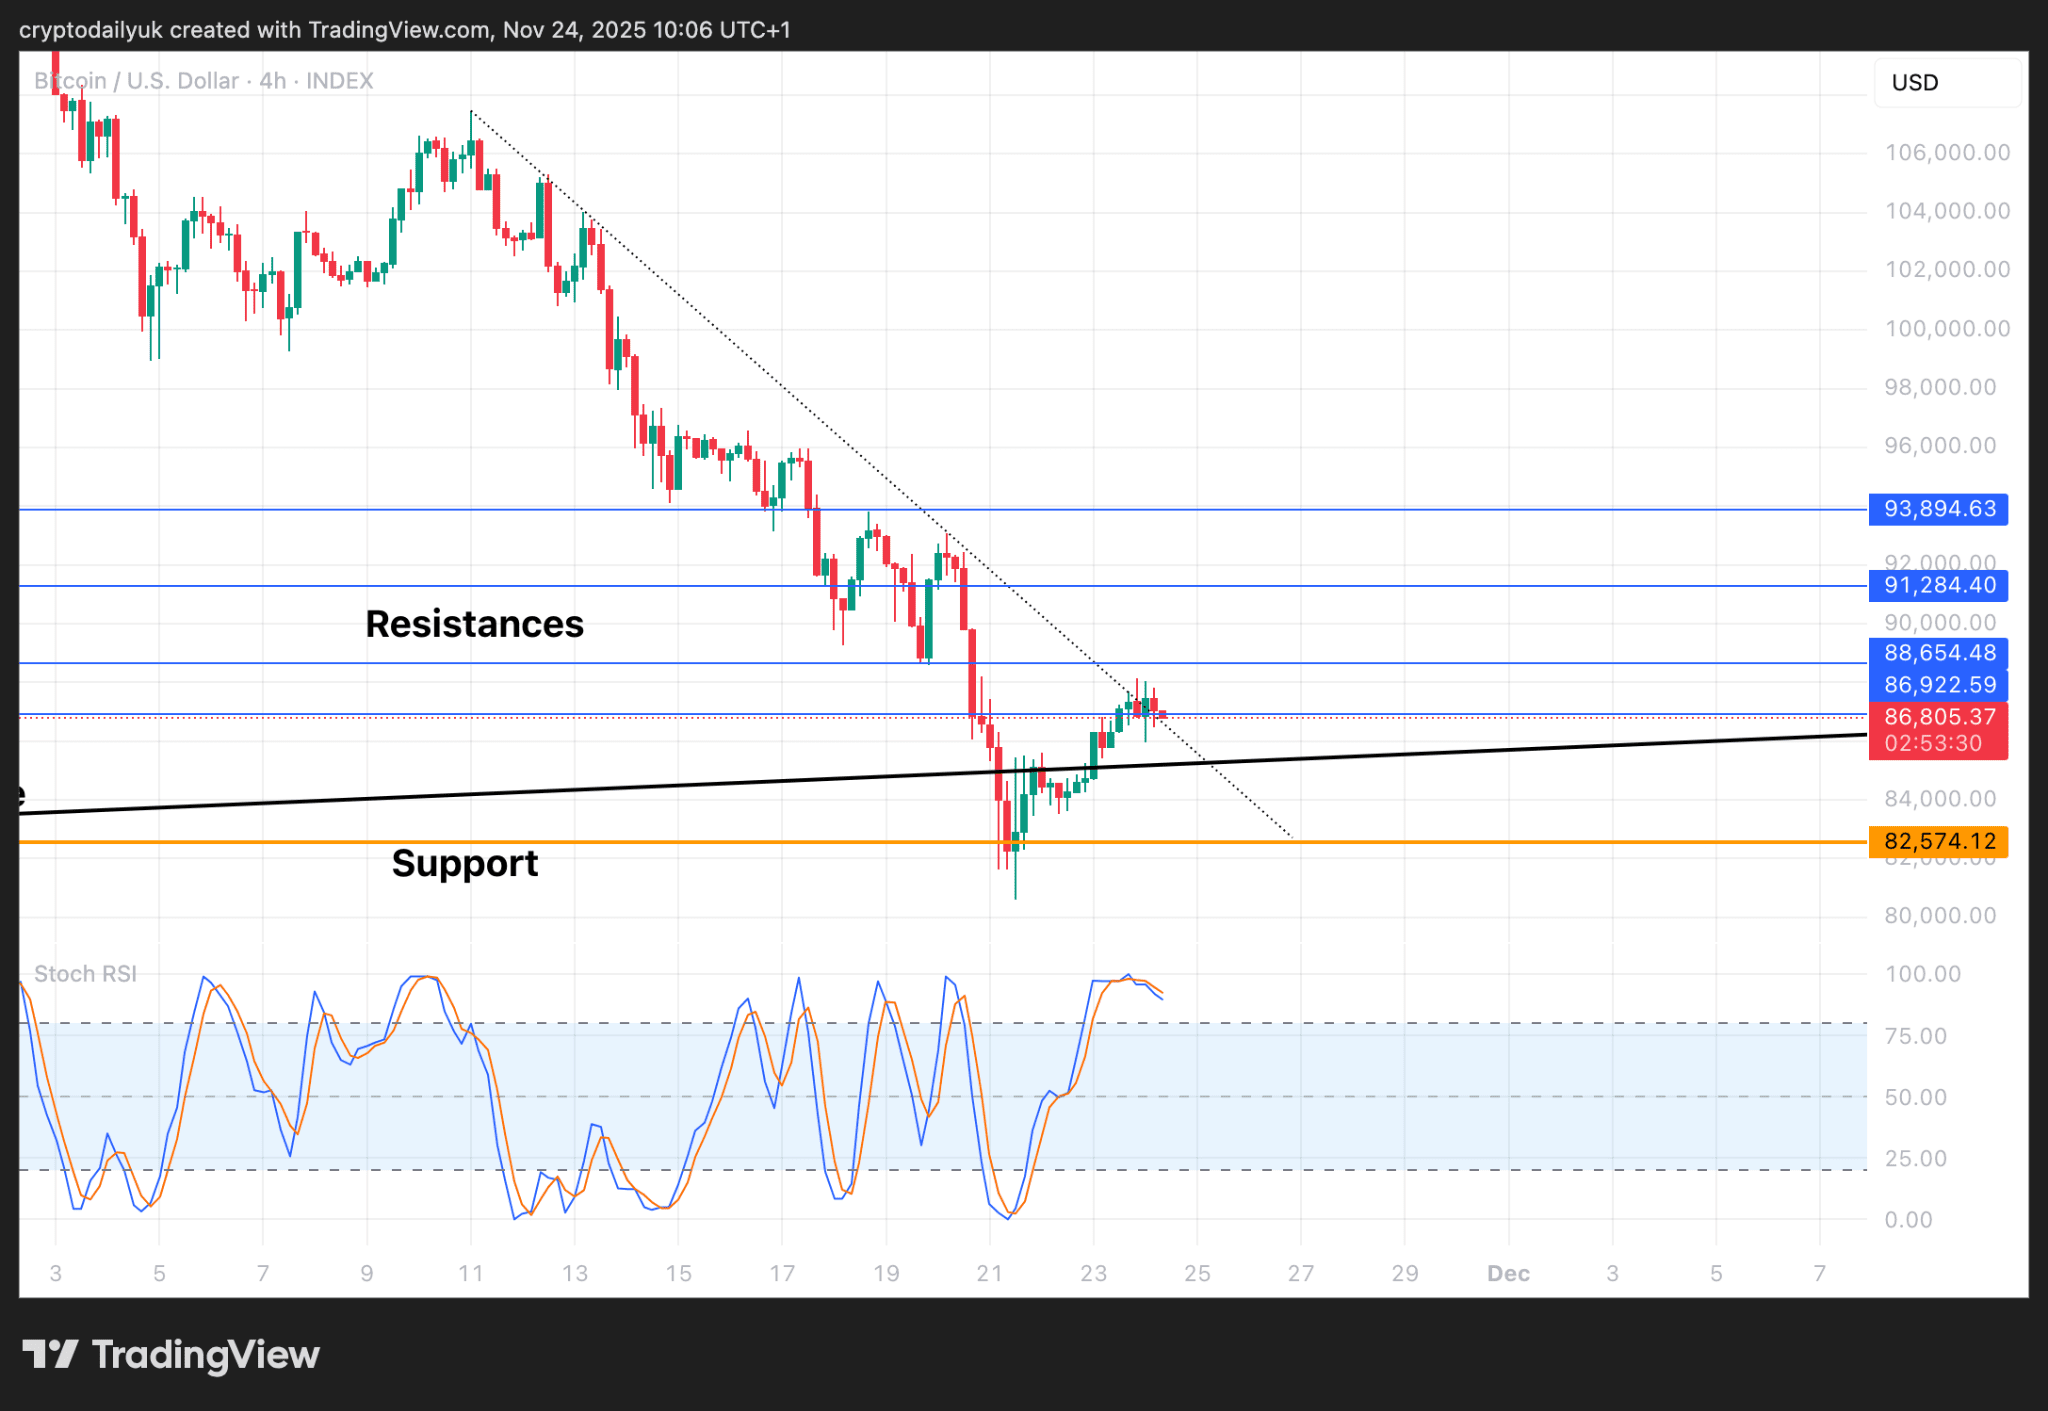
The 4-hour chart for BTC shows that the price is stabilizing near the support level of $82,600. Although this support level is not particularly strong, a rebound is needed to confirm or overturn the previous downtrend due to the earlier price breach of the main trend line. The bulls have ultimately succeeded in pushing the price back above the trend line. A retest of the trend line may now be needed.
Although the price is attempting to consolidate above the minor downtrend line (light dashed line), given that the short-term momentum indicators are currently in overbought territory, the price may slide back below this line, and it could even break below the main trend line.
As long as the support level of $82,000 can hold, the current slight decline may form a double bottom, and the price is expected to start a real rebound from here. If this bottom fails to hold, $73,000 may be a target level.
The 0.786 Fibonacci sequence provides support.
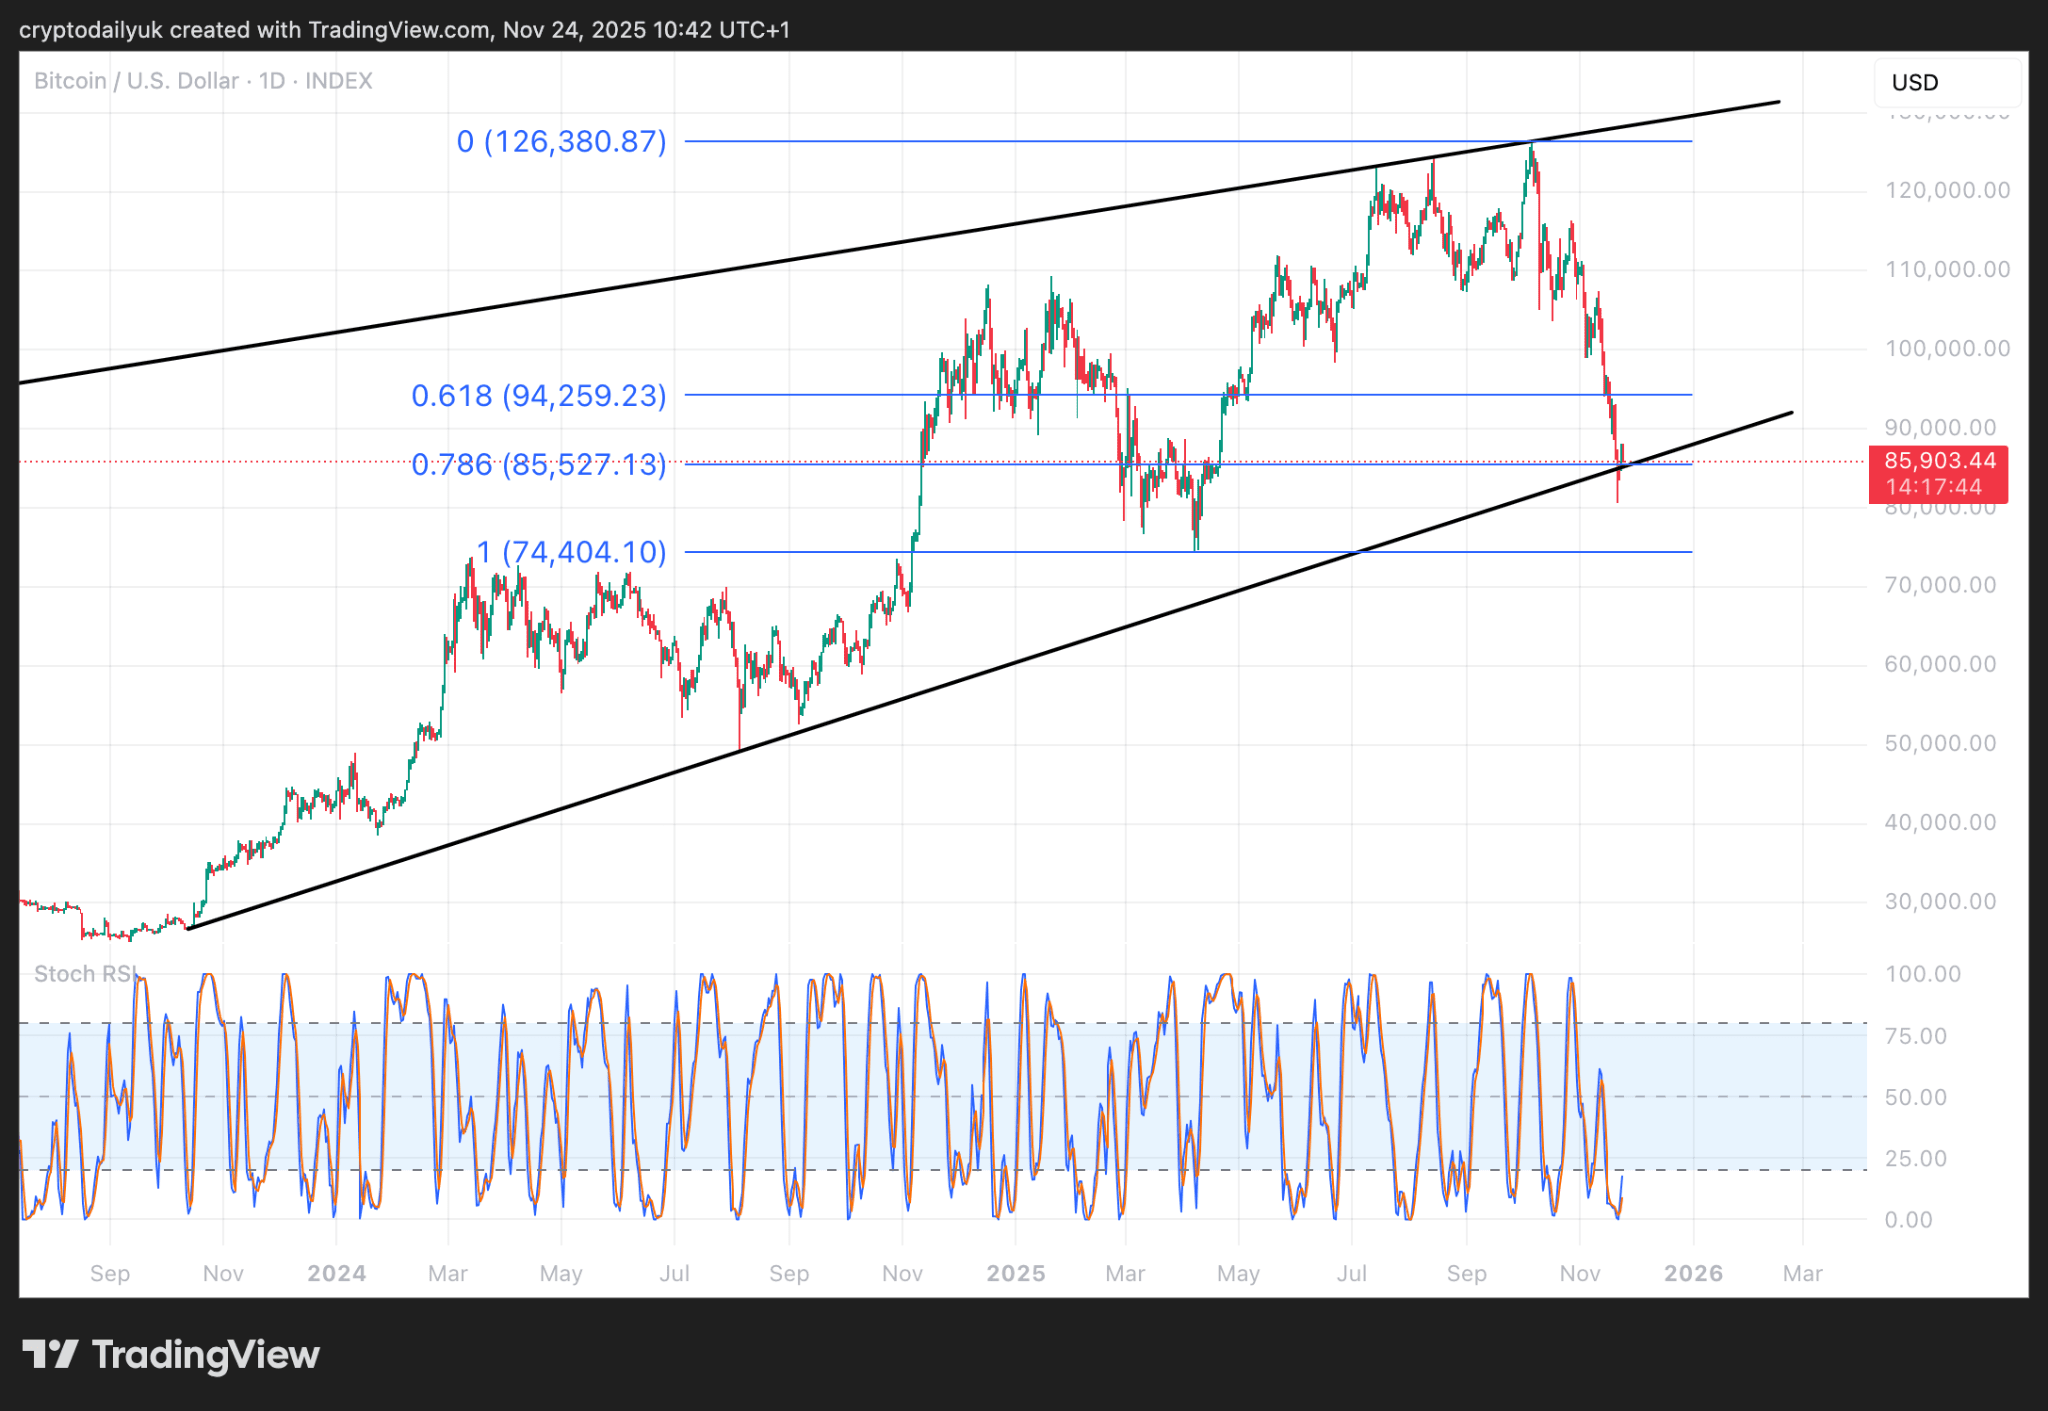
The Bitcoin daily chart shows that, in addition to the main trend line, the 0.786 Fibonacci retracement level may also play an important role. The price has bottomed at this low point, creating an excellent position for a rebound. Additionally, this level serves as a good support level, and the Stochastic RSI has crossed above, further reinforcing the view that the price will rebound from here.
High time frame momentum indicators have reset.
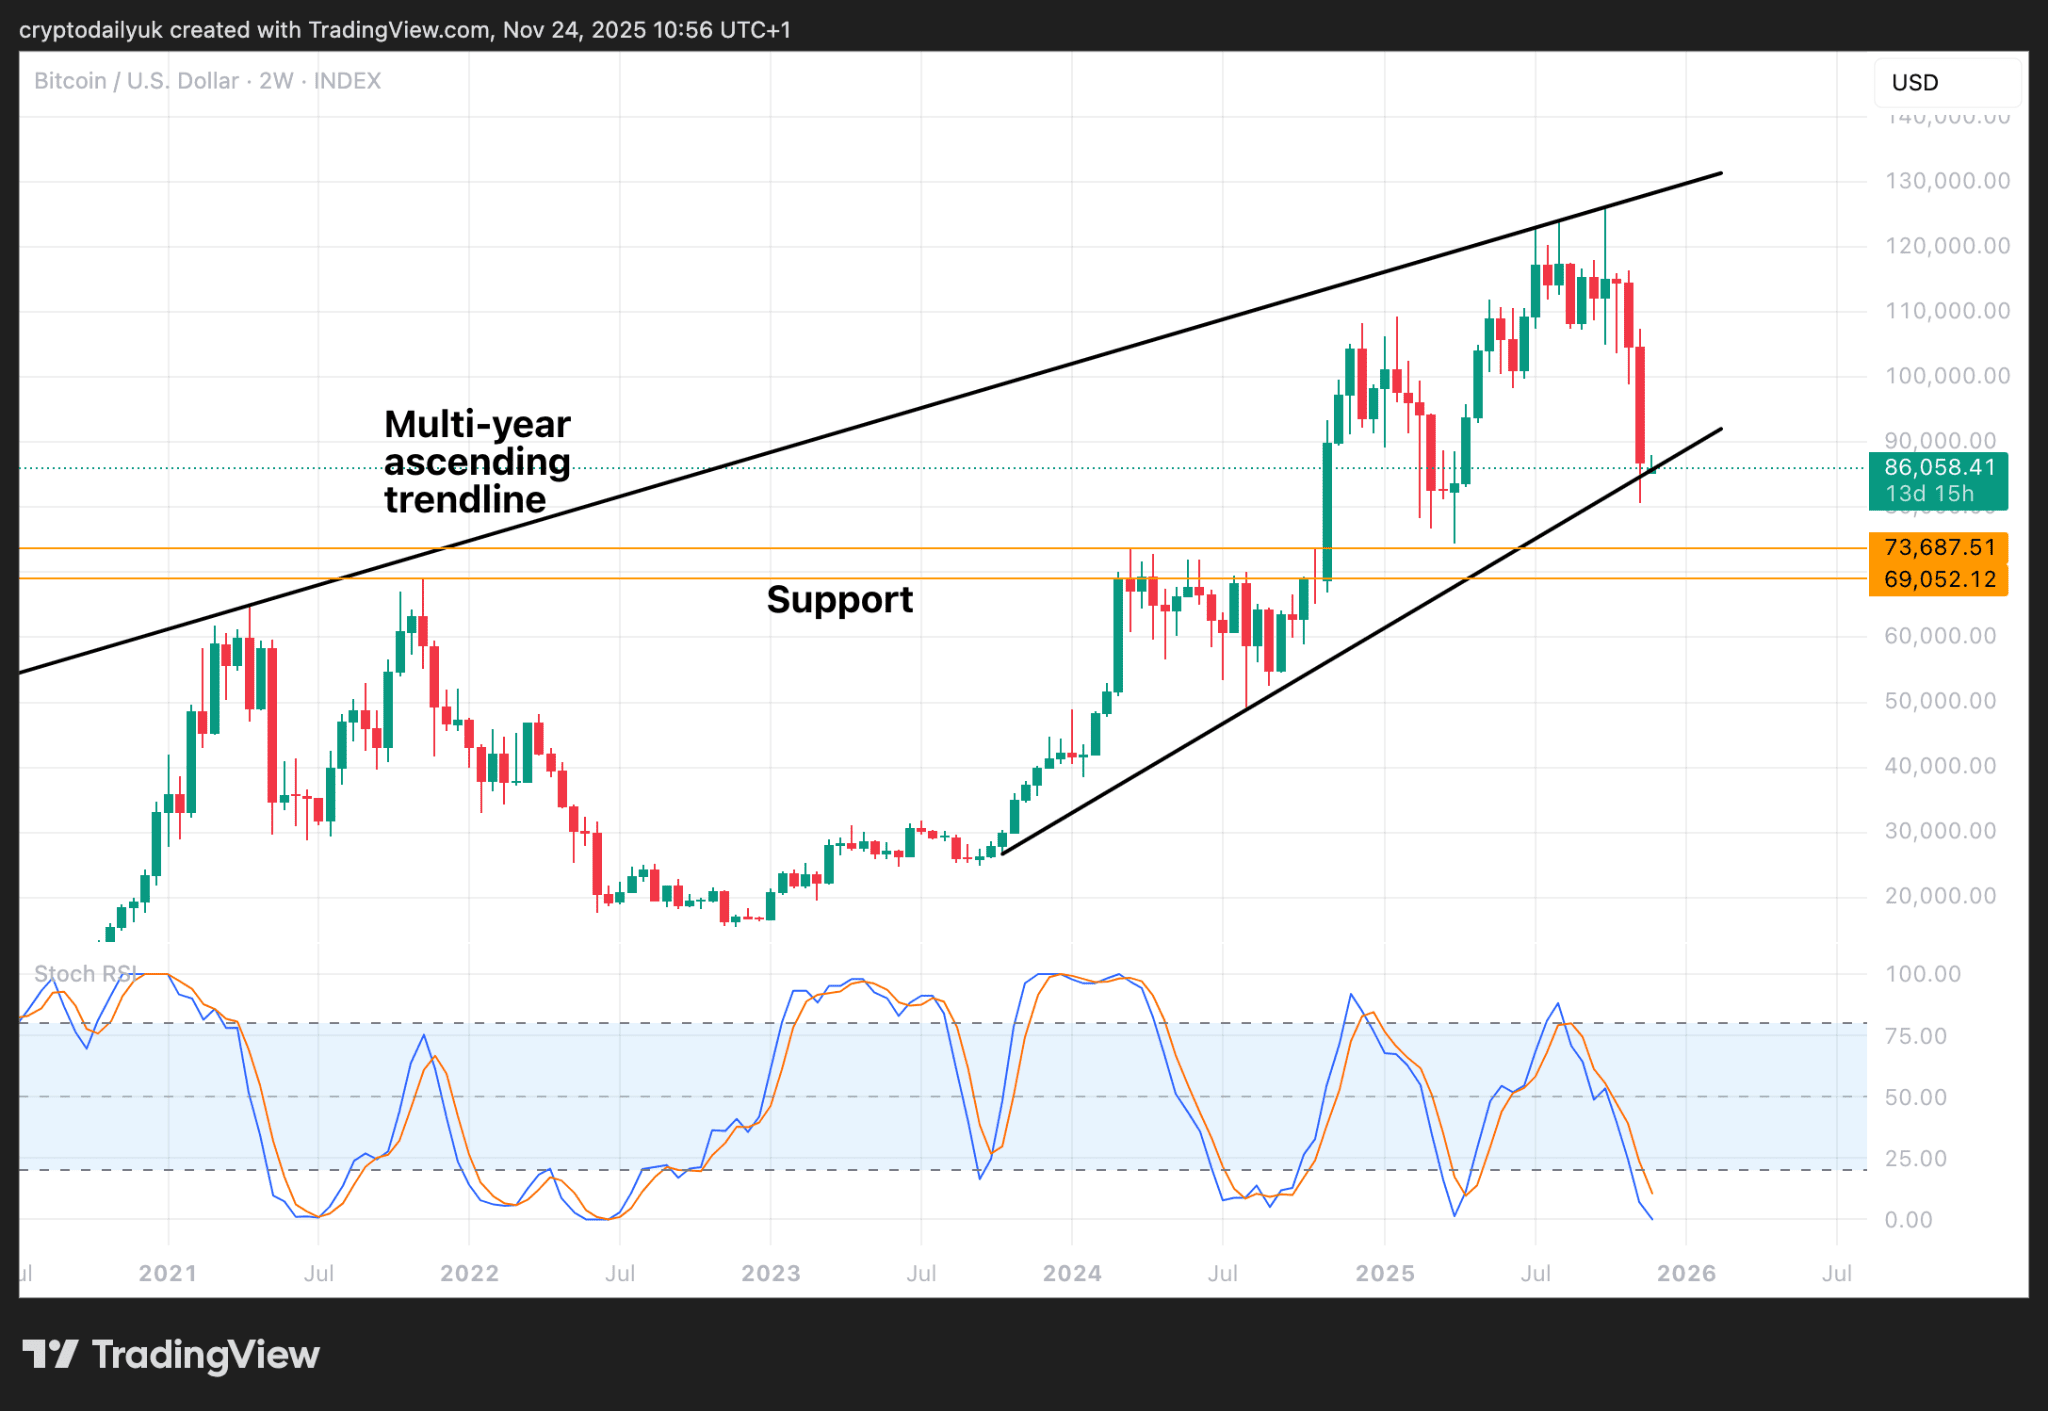
The two-week chart shows that the current Bitcoin correction may have ended or is nearing its end. As it stands, the main trend line seems to have halted the decline. If the price dips again, the area between $74,000 and $69,000 (the top of the last bull market) will constitute extremely strong support.
Moreover, there is a very strong indicator—the two-week Stochastic RSI. It can be seen that this indicator line has currently bottomed out. Combined with the weekly Stochastic RSI, these indicators may suggest a strong upward momentum for the price in the coming weeks.
